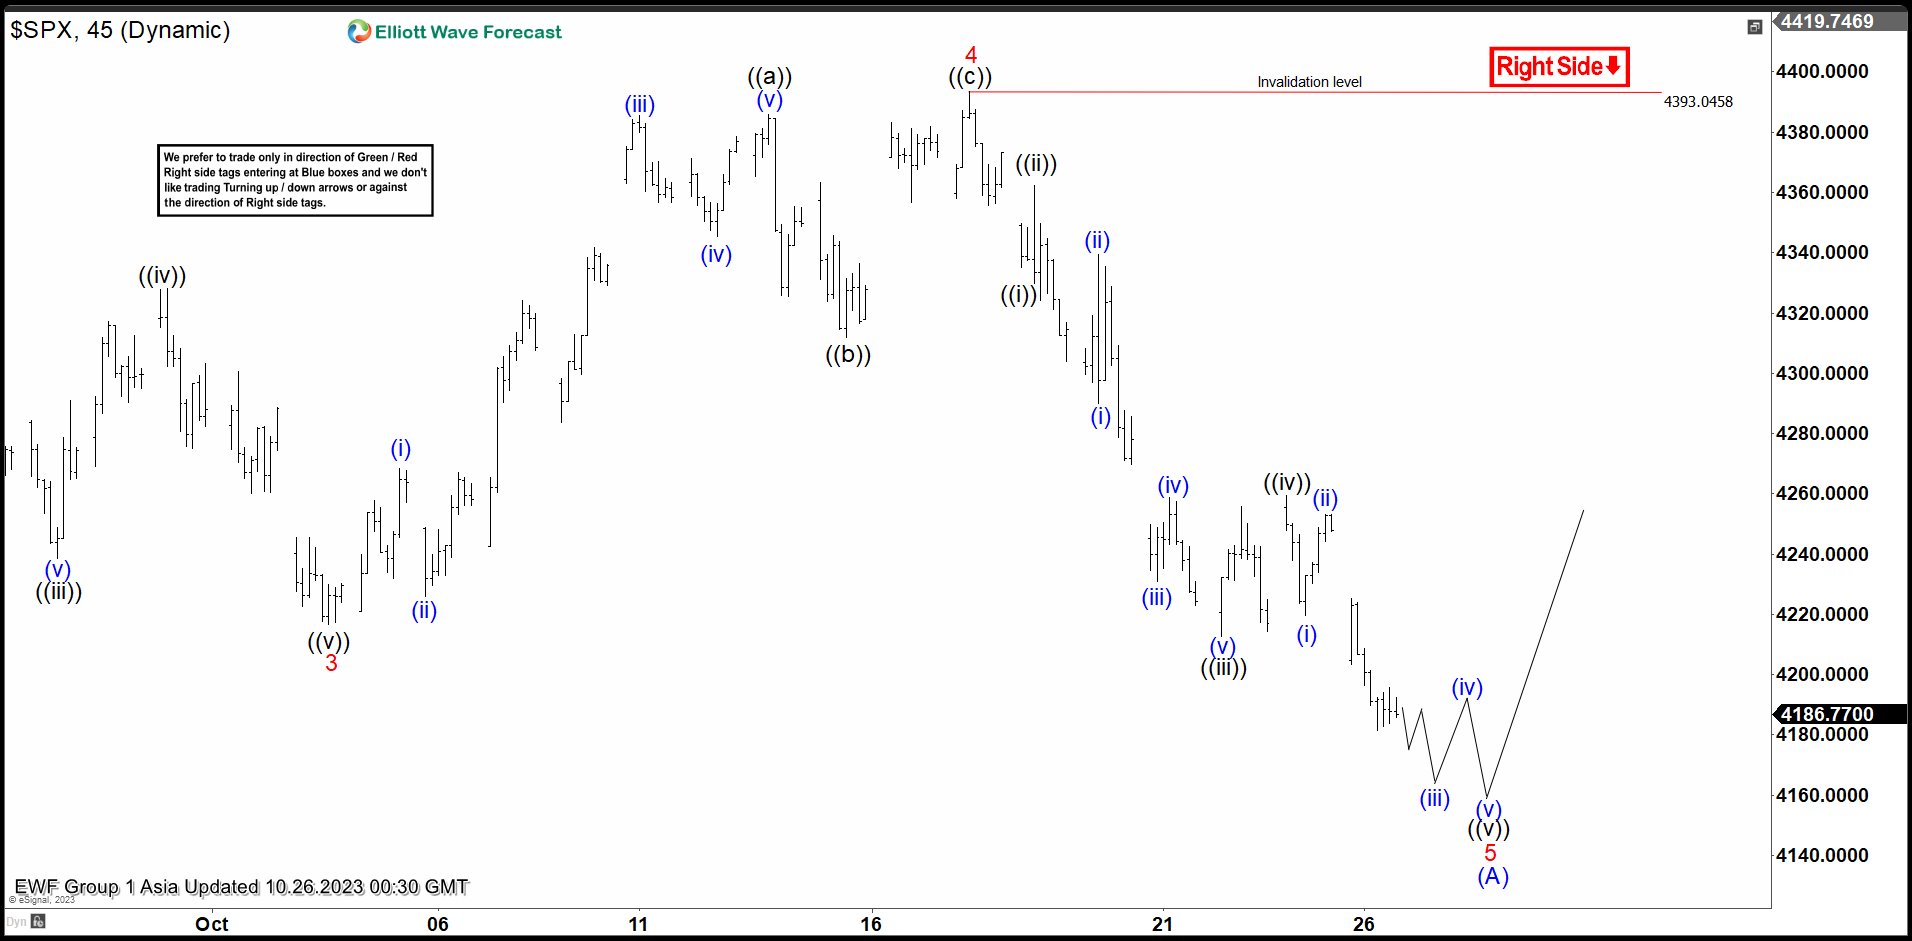
 Image Source: PexelsShort term Elliott Wave View in S&P 500 (SPX) suggests that cycle from 7.28.2023 high is in progress as a diagonal structure. Down from 7.28.2023 high, wave 1 ended at 4344.75 and rally in wave 2 ended at 4532.26. Index resumes lower in wave 3 towards 4216.45 as the 45 minutes chart below shows. Wave 4 ended at 4393.04 with internal subdivision as a zigzag structure. Up from wave 3, wave ((a)) ended at 4385.85 and pullback in wave ((b)) ended at 4311.97. The Index then extended higher in wave ((c)) towards 4393.04 which completed wave 4.S&P 500 (SPX) has resumed lower in wave 5. Down from wave 4, wave ((i)) ended at 4329.7 and rally in wave ((ii)) ended at 4346.92. Index is nesting lower with wave (i) of ((iii)) ended at 4290 and wave (ii) ended at 4339.54. The Index continued lower in wave (iii) towards 4230.99 and wave (iv) ended at 4258.67. Final leg wave (v) ended at 4212.5 which completed wave ((iii)). Rally in wave ((iv)) ended at 4259.38. Wave ((v)) is now in progress to end wave 5 of (A) in higher degree. Near term, as far as pivot at 4393.04 stays intact, expect the Index to continue lower.S&P 500 (SPX) 45 Minutes Elliott Wave Chart
  SPX Elliott Wave VideoVideo Length: 00:07:56More By This Author:Bitcoin Looking To Extend Higher As Impulse EURJPY Extends Higher In Bullish Cycle Alphabet Inc. Reacting Higher From Blue Box Area


Leave A Comment