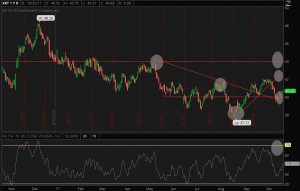
This week’s Chart of the Week features the XRT ETF (S&P 500 retail sector) and its potential to break out to the upside. From a technical perspective, it appears that the $40 level of support for XRT has held very well and the RSI is indicating that a bottom was formed last week.
Over the last couple weeks, XRT bounced off a trend line that was formed in May 2017 and reclaimed the $40 level by closing at $40.65 on Friday (as outlined in the chart). We are now looking for a move higher to $44 and this will also result in the RSI moving to the mid 70’s from where it stands now at roughly 50. The levels to watch to the upside are $41 and $42.85 before reaching our $44 target. In addition to the technicals, we believe that earnings over the next month will also be stronger than expected as retail stores and the traditional brick and mortar retail giants have been adapting to the changing retail environment. By combining the potential for stronger than expected earnings and a phenomenal technical setup, we believe that the XRT ETF could move nearly 10% higher by the end of 2017.


Leave A Comment