A preliminary read on Consumer Confidence surprised to the upside, but shortly after 10 AM release of that news, the S&P 500 moved lower in the first of two bouts of selling in today’s session. After trimming a bit of the morning loss, a second wave down after the lunch hour sent the index to its -0.46% intraday low. A bit of buy-the-dip mentality took hold and lifted the index to its modest 0.20% close. The big news this week, as the market pundits are quick to point out, is Friday’s employment report. Will the market see a good jobs report as bad news? An omen of a less accommodative Fed?
The yield on the 10-year note closed at at 1.57%, unchanged from the previous close.
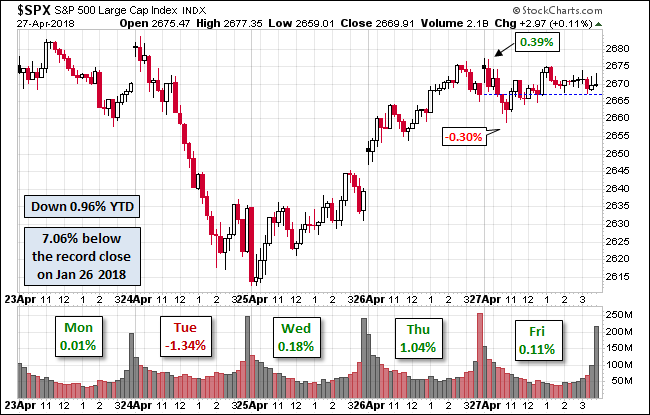
Here is a snapshot of past five sessions in the S&P 500.

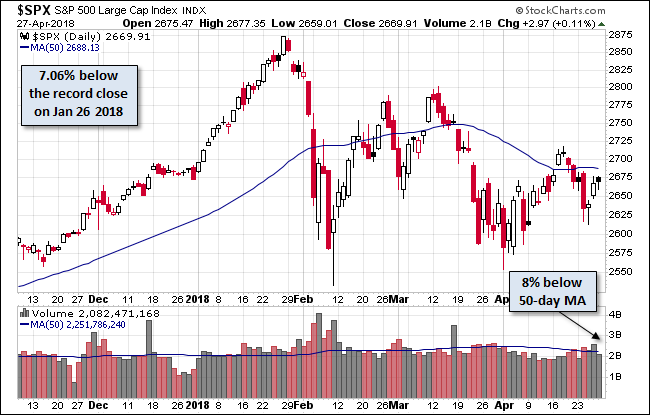
Here is daily chart of the index. Volume increased slightly above Monday’s 2016 low but remains in late summer doldrums.

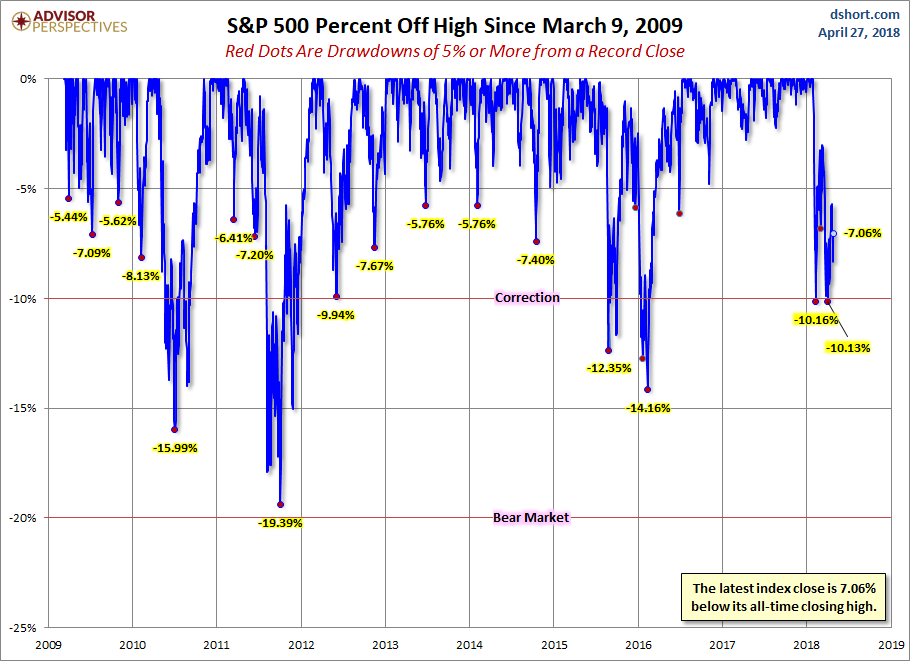
A Perspective on Drawdowns
Here’s a snapshot of selloffs since the 2009 trough.

Here is a more conventional log-scale chart with drawdowns highlighted.

Here is a linear scale version of the same chart with the 50- and 200-day moving averages.

A Perspective on Volatility
For a sense of the correlation between the closing price and intraday volatility, the chart below overlays the S&P 500 since 2007 with the intraday price range. We’ve also included a 20-day moving average to help identify trends in volatility.


Leave A Comment