Thursday’s -0.37% finish in the S&P 500 dropped the index fractionally into the red, down 0.19% year-to-date, but today’s 0.60% advance lifted it back into the green up 0.41% after 97 market days in 2016. The index also closed the week up 0.28%, snapping a three-week losing streak. The Dow, on the other hand, despite its 0.38% advance today, extended its weekly losing streak to four weeks. With six trading days remaining in the proverbial “sell in May”, the S&P 500 is down only 0.63% for the month.
The yield on the 10-year note closed at 1.85%, unchanged from the previous close but up 14 basis points from last Friday.
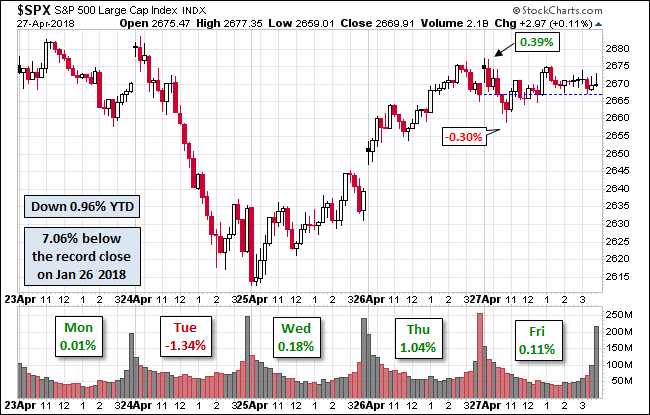
Here is a snapshot of past five sessions in the S&P 500.
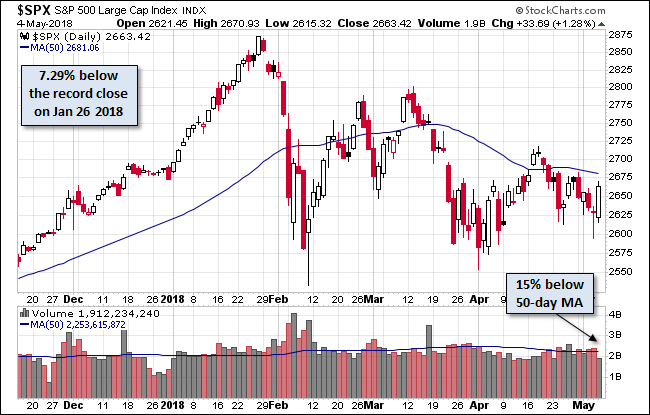
On the daily chart we see that today’s intraday high was just a tad below the 50-day moving average. Trading volume was unremarkable.
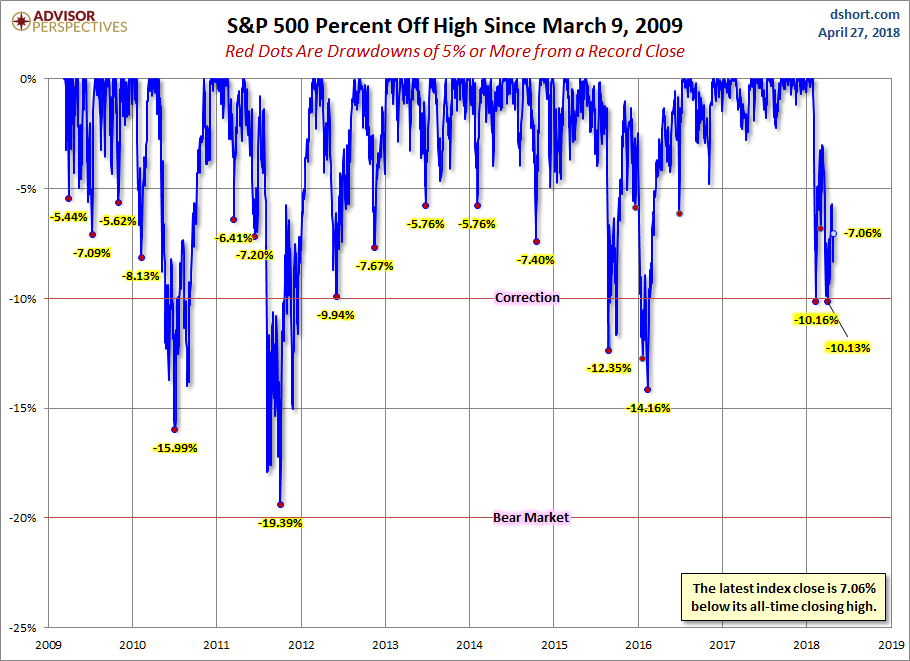
A Perspective on Drawdowns
Here’s a snapshot of selloffs since the 2009 trough.
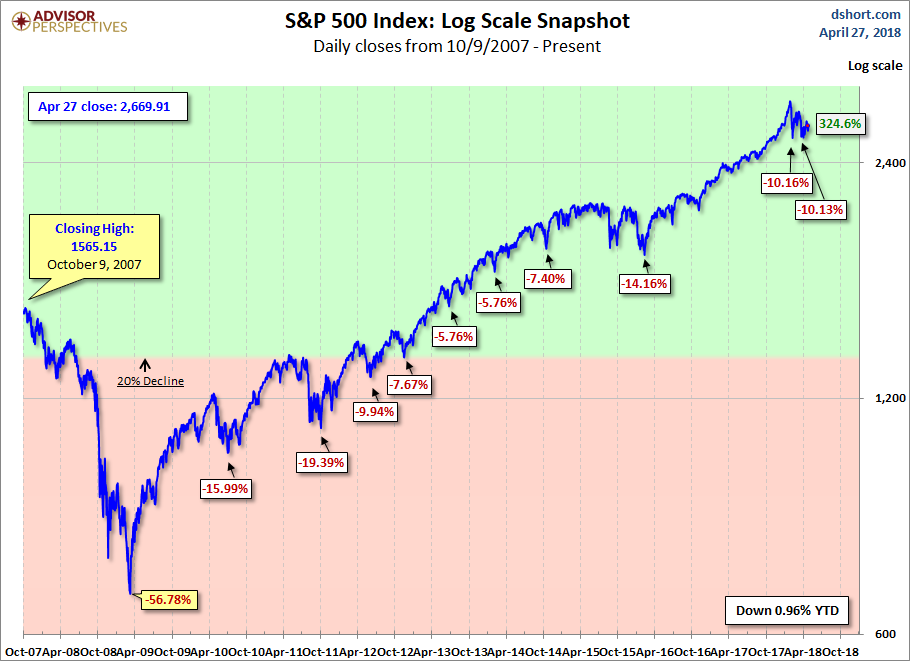
Here is a more conventional log-scale chart with drawdowns highlighted.
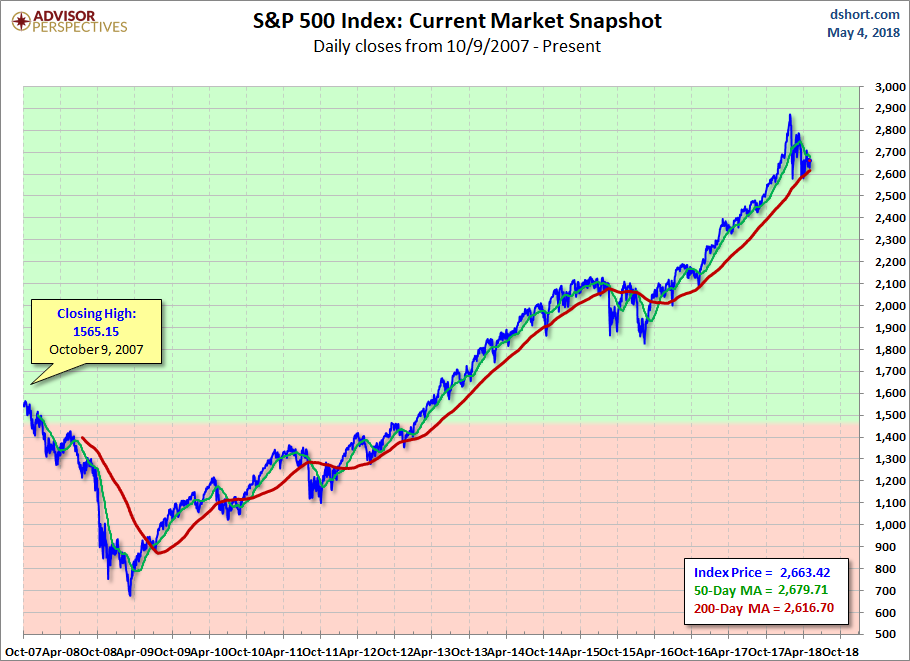
Here is a linear scale version of the same chart with the 50- and 200-day moving averages.
A Perspective on Volatility
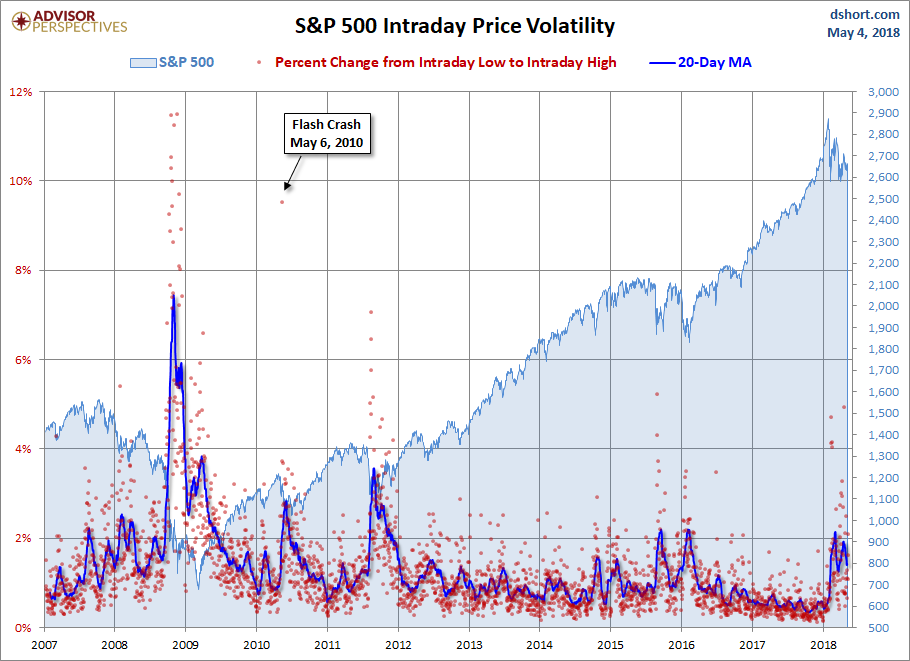
For a sense of the correlation between the closing price and intraday volatility, the chart below overlays the S&P 500 since 2007 with the intraday price range. We’ve also included a 20-day moving average to help identify trends in volatility.


Leave A Comment