Stock prices tend to act like a spring. The further they are stretched to their limits, the further they tend to snap back in the opposite direction.

The opposite is also true. When stock prices are not stretched very far, they don’t recoil nearly s far in the opposite direction when the stretching force is removed. This is particularly true of large baskets of stock – stock indexes such as the Dow, Nasdaq or S&P 500 – since the forces that can move an index are limited. Earnings or other news can move an individual stock, but for a large index the news tends to be anticipated and slowly baked in, limiting it’s overall effect; thus recoil is often one of the largest forces affecting the movement of an index such as the S&P 500.
Without a Bear market to stretch stock prices too low, there is simply not as much force to propel stock prices higher when temporary bouts of selling tension are released. This past October saw a rather substantial period of selling tension, but even at the lowest of the lows, the S&P 500 barely met one the most lenient criteria of a Bear market – one such criterion being the lack of profitability of $SPY Covered Call options.
Other criteria, including the ubiquitous definition of a Bear market being a 20% decline off the highs, were not met this past October. Now that the stock market seems to have heated up once again, it may be helpful for traders to consider just how much tension there was in the spring. In other words, how much upward momentum do current stock prices have considering effect of the rather meager pullback from October?
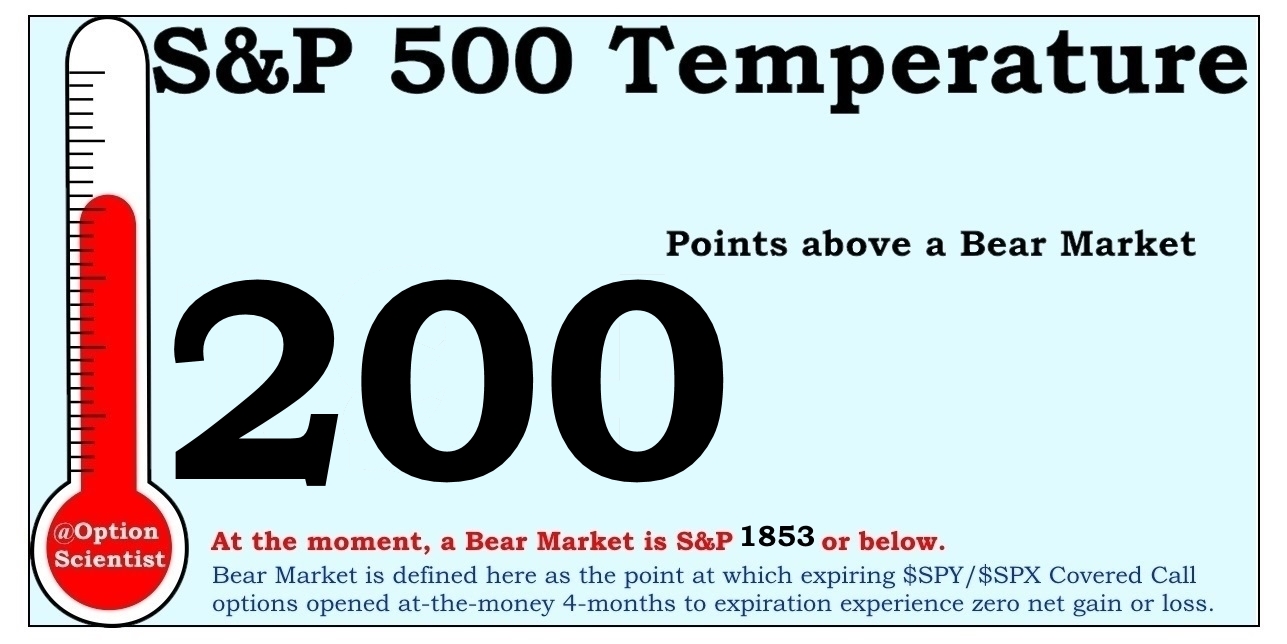
One way of measuring the snap-back momentum is to look not just at how hot the stock market currently is, but how hot it has gotten, historically, after meager pullbacks like the one that just happened a few weeks ago. From the following chart, it becomes clear that few rallies get so hot as to exceed the 10%-above-Bear level, and only then when the rally was preceded by a significant Bear market. The current rally in the S&P 500 may therefore be reaching it’s upper limit, temporarily perhaps, but reaching a limit nonetheless. If past instances are any indication, the current rally may have used up nearly all the momentum it gained from October’s pullback. Historically, it doesn’t get much hotter than this – hotter than 10% above Bear (at the current level of the S&P 10% above a Bear market equates to about 200 points). It does not get much hotter than this unless it follows a significant Bear market.


Leave A Comment