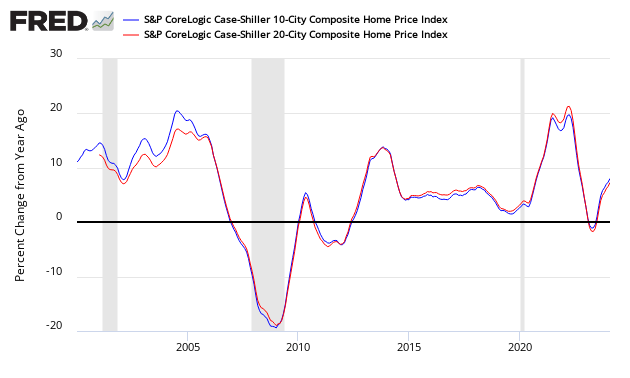
The non-seasonally adjusted S and P CoreLogic Case-Shiller home price index (20 cities) year-over-year rate of home price growth decelerated from an upwardly revised 6.4 % to 5.9 %. The index authors stated “The slowing is widespread: 15 of 20 cities saw smaller monthly increases in July 2018 than in July 2017″.

Analyst Opinion of Case-Shiller HPI
Many pundits believe home prices are back in a bubble. Maybe, but the falling inventory of homes for sale keeps home prices relatively high. I continue to see this a situation of supply and demand. It is the affordability of the homes which is becoming an issue for the lower segments of consumers.
S&P/Case-Shiller Home Price Indices Year-over-Year Change

Comparing the NAR and Case-Shiller home price indices, it needs to be understood each of the indices uses a unique methodology in compiling their index – and no index is perfect.
The way to understand the dynamics of home prices is to watch the direction of the rate of change. Here home price growth generally appears to stabilize (rate of growth not rising or falling).
There are some differences between the indices on the rate of “recovery” of home prices.
A synopsis of Authors of the Leading Indices:
Case Shiller’s David M. Blitzer, Chairman of the Index Committee at S&P Indices:
Rising homes prices are beginning to catch up with housing. Year-over-year gains and monthly seasonally adjusted increases both slowed in July for the S&P Corelogic Case-Shiller National Index and the 10 and 20-City Composite indices. The slowing is widespread: 15 of 20 cities saw smaller monthly increases in July 2018 than in July 2017. Sales of existing single family homes have dropped each month for the last six months and are now at the level of July 2016. Housing starts rose in August due to strong gains in multifamily construction. The index of housing affordability has worsened substantially since the start of the year.
Since home prices bottomed in 2012, 12 of the 20 cities tracked by the S&P Corelogic Case-Shiller indices have reached new highs before adjusting for inflation. The eight that remain underwater include the four cities which led the home price boom: Las Vegas, Miami, Phoenix and Tampa. All are enjoying rising prices, especially Las Vegas which currently has the largest year-over-year increases of all 20 cities. The other cities where prices are still not over their earlier peaks are Washington DC, Chicago, New York and Atlanta.


Leave A Comment