Presently, the state of US trade deficit and how the Trump administration is attempting to address it is front and center.

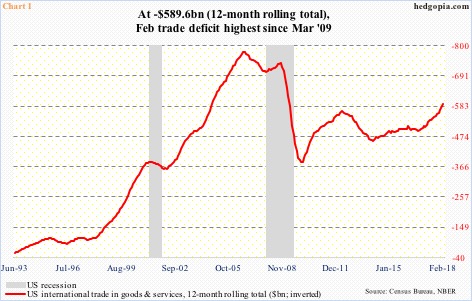
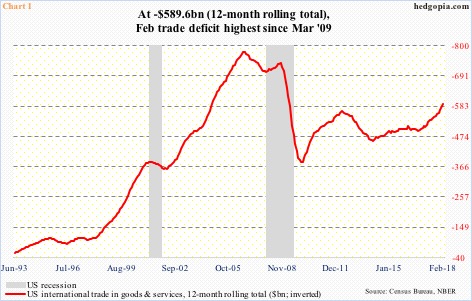
In February, the deficit came in at $57.6 billion, with the 12-month total of $589.6 billion, which was the highest since March 2009 (Chart 1). China – a manufacturing hub – is a big part of this. The Administration is trying to remedy the situation through imposition of tariffs.
On March 1, Trump promised 25-percent tariffs on steel imports and 10-percent on aluminum imports.US stocks fell in that session (Thursday) and again early in the next session before buyers showed up.Late Tuesday last week, the president announced 25-percent tariffs on $50 billion worth of Chinese imports.Wednesday, stocks opened down but that weakness was bought.Less than 12 hours after the tariff announcement, China issued a list of US products worth $50 billion for possible tariff hikes.Then on Thursday, Trump proposed $100 billion in additional tariffs against China.Markets did not take this nicely.Major US equity indices fell north of two percent on Friday.If the US releases a list of $100 billion worth of tariffs, China in all likelihood will follow suit.
Where is this headed? Is what looks like a skirmish right now on its way to evolving into a war? More importantly, were stocks looking for a reason to sell off anyway and the trade dispute just became an excuse?

The S&P 500 large cap index peaked on January 26 at the all-time high of 2872.87.From that peak through the intraday reversal low of 2532.69 on February 9, it then collapsed 11.8 percent. We are talking 11 sessions peak to trough!The selloff began well ahead of tariff imposition.
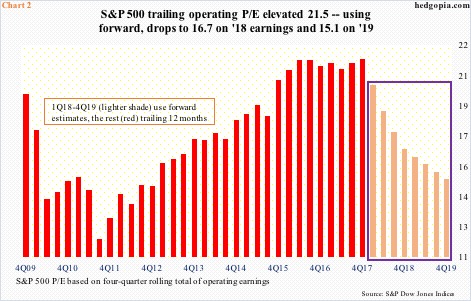
The bull market in US stocks is in its 10th year.Multiples accordingly have persistently risen. As a matter of fact, using trailing 12 months of operating earnings through 4Q17, the S&P 500 traded at 21.5x. This is expensive. The price-to-earnings ratio drops using forward estimates, but the question then becomes one of reliability.


Leave A Comment