Initial Reaction
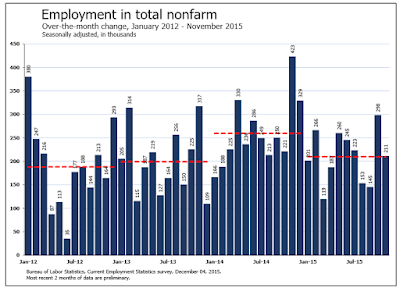
Following last month’s payroll surge comes a second strong month. The Bloomberg Consensus estimate was 190,000 jobs and the headline total was 211,000. The unemployment rate was steady to 5.0%, the lowest since April 2008. A rate hike in December is now assured.
BLS Jobs Statistics at a Glance
Employment Report
Please consider the Bureau of Labor Statistics (BLS) Current Employment Report.
Total nonfarm payroll employment increased by 211,000 in November, and the unemployment rate was unchanged at 5.0 percent, the U.S. Bureau of Labor Statistics reported today. Job gains occurred in construction, professional and technical services, and health care. Mining and information lost jobs.
Unemployment Rate – Seasonally Adjusted

Nonfarm Employment

Click on Any Chart in this Report to See a Sharper Image
Nonfarm Employment Change from Previous Month by Job Type

Hours and Wages
Average weekly hours of all private employees was down 0.1 hours to at 34.5 hours. Average weekly hours of all private service-providing employees was unchanged at 33.4 hours.
Average hourly earnings of private workers rose $0.01 to $21.19. Average hourly earnings of private service-providing employees rose $0.01 to $20.99.
For discussion of income distribution, please see What’s “Really” Behind Gross Inequalities In Income Distribution?
Birth Death Model
Starting January 2014, I dropped the Birth/Death Model charts from this report. For those who follow the numbers, I retain this caution: Do not subtract the reported Birth-Death number from the reported headline number. That approach is statistically invalid. Should anything interesting arise in the Birth/Death numbers, I will add the charts back.
Table 15 BLS Alternate Measures of Unemployment


Leave A Comment