I don’t think I have seen as badly, or worse, outright misleading reporting in a long time as I have seen concerning September auto sales.
Almost all of the stories — and especially the Doomish punditry that dominates the clickbait econoblogosphere — have seized on the BIG BIG DOWNTURN!!! in auto sales YoY, varying between a -5.6% decline (“So, all in all it was a lousy month”) to a 7% decline (“Auto sales sputtered … Several major auto makers reported steep declines in U.S. sales”). Or, “U.S. Auto Sales Look Shaky, Could Be Start to Rough Road Ahead.”
OMG, head for the hills!
Then, down maybe 10 paragraphs (if at all), it’s noted that the YoY comparison is with the spike in replacement sales that occurred after Hurricane Harvey dumped up to 50? of rain on east Texas, including the 6 million population Houston metro.
Oh.
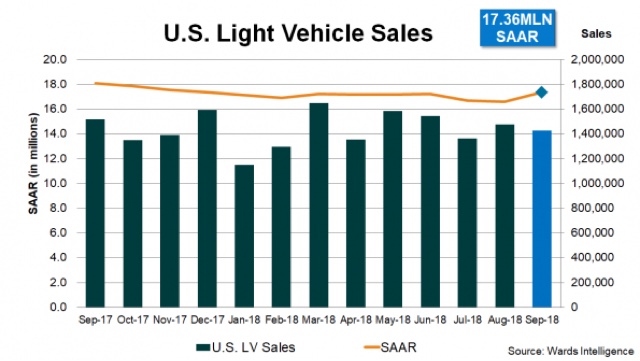
And somewhere before the end of the article, it might be grudgingly conceded that the seasonally adjusted annualized rate of sales for September 2018 might be over 17 million. In fact, the two best estimates are 17.3 million from Ward’s Intelligence, and 17.4 million from AutoData. Here’s the graph from Ward’s:

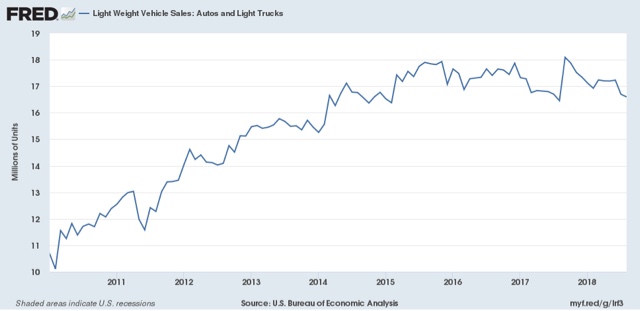
So, how does 17.3 or 17.4 million look compared to recent data?
Here are monthly light vehicle sales since 2010 (through August):

There were only two months since the beginning of 2017 that exceeded 17.3 million sales annualized, one of which was last September. In fact, 17.3 million units is right in line with average sales during the best two years of this expansion.
And, speaking of hurricanes, Florence probably knocked out sales for the eastern halves of North and South Carolina last month. Since the population of these two states combined is about 16 million (or about 4.6% of the US population), figure that Florence subtracted a little over 2% from this September’s sales. Adjusting for that would bring sales to 17.6 or 17.7 million annualized.


Leave A Comment