For only the 3rd time since March 2009, the S&P 500 closed last week at a new 52-week low. Naturally, the chatter among so-called “traders” was that this was an ominous sell signal.
Indeed, from Investopedia we find the following:
“A popular strategy used by stock traders is to buy when price exceeds its 52-week high, or to sell when price falls below its 52-week low. The rationale behind this strategy is that if price breaks out from the 52-week range (either above or below) there will be enough momentum to continue the price move in a favorable direction.”
When looking at the S&P 500, how would such a strategy have done going back to 1929? As it turns out: terrible. The S&P 500 (on a weekly basis), has closed at a 52-week low 4.5% of the time since 1929.
The average forward returns after such a condition were actually higher than returns following 52-week closing highs in the following periods: 1 month, 3 months, 1 year, 3 years, and 5 years. Only the 6-month forward return was lower in buying new 52-week lows vs. new 52-week highs (see Table below with highlighted box on the highest average return).

Since 1950, we find similar results. Selling new 52-week lows does not appear to be effective strategy.

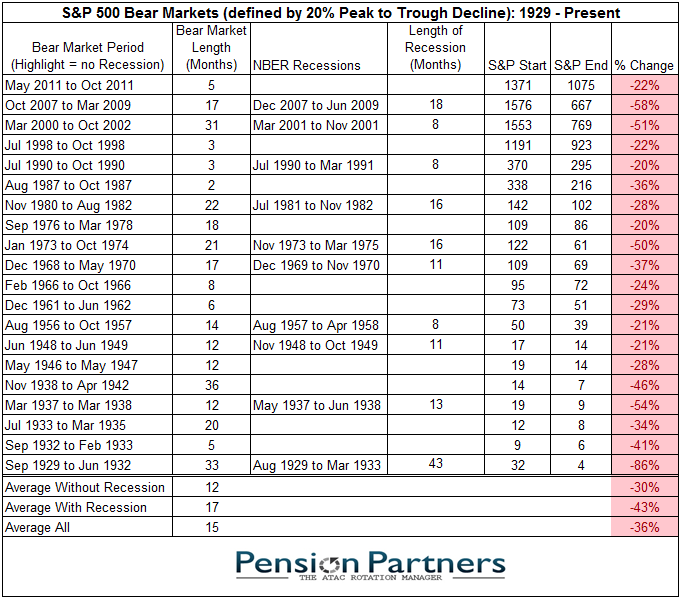
How can this be? Well, your favorite trader is probably unfamiliar with the phrase “buy low” but it does tend to make sense for investors over time. And given that the average length of recession since 1929 is 15 months, by the time the market is making a new 52-week low it typically has already suffered a significant decline.

Now of course there are exceptions to buying new 52-week lows and expecting positive returns within the next few years. Among these, the Great Depression is the most glaring as it suffered a Bear Market that was 33 months in duration. If you believe that we are entering another Great Depression, then, perhaps selling the 52-week lows here will prove to be a good strategy in hindsight.


Leave A Comment