There is a corner on silver, but if you study the charts, silver cannot avoid going lower on the very short term.
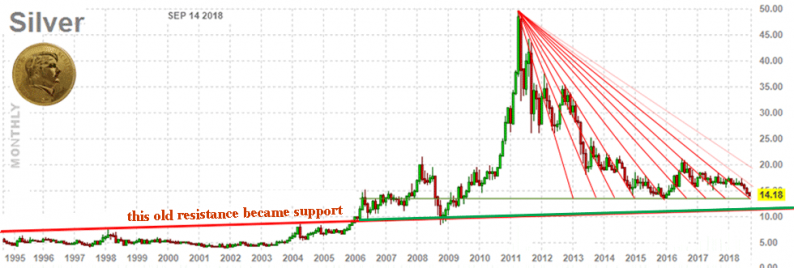
On this chart of silver since 1994, I drew the resistance that blocked every upper spike before 2006. The resistance had been broken in January 2006. There had been a pull-back 5 months later and another pull-back during 2008 systemic krach. Silver is about to test this resistance one more time.
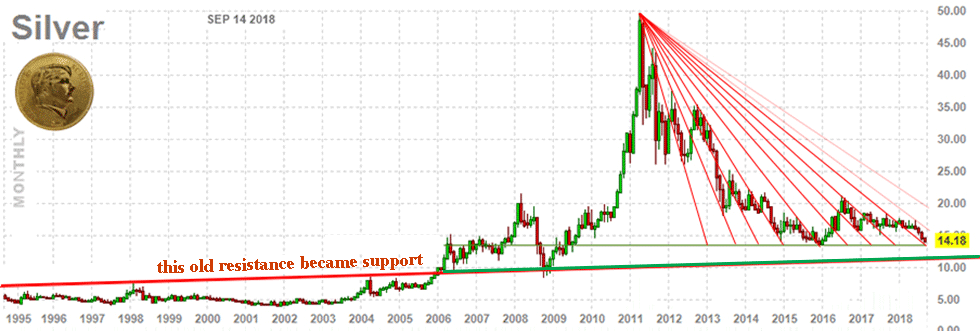
For years, the Fibonacci fans have had a very important role in the trading of silver.
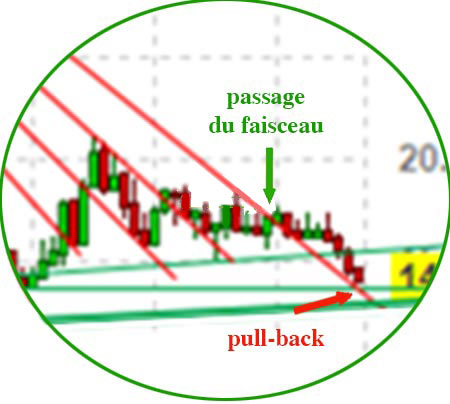
Each time that a fan had been broken upwards, there had been a pull-back on the fan. Sometimes, you slide downwards along the fan for months, sometimes a quick pull-back is enough.
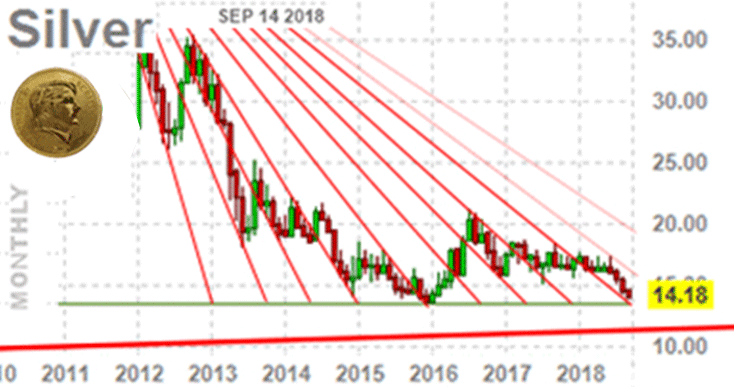
On this chart, you can see that the last fan had been broken upwards in January 2018, followed by a pull-back in February.
But since April, as silver prices are going down, we are sliding downwards along that fan.
We are about to make a new pull-back at the end of September and touch again the horizontal support of December 2015 at $13,73.
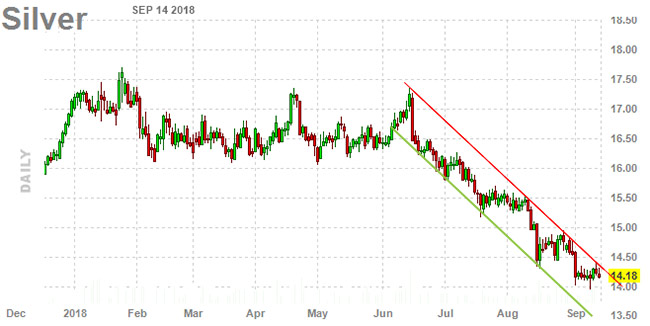
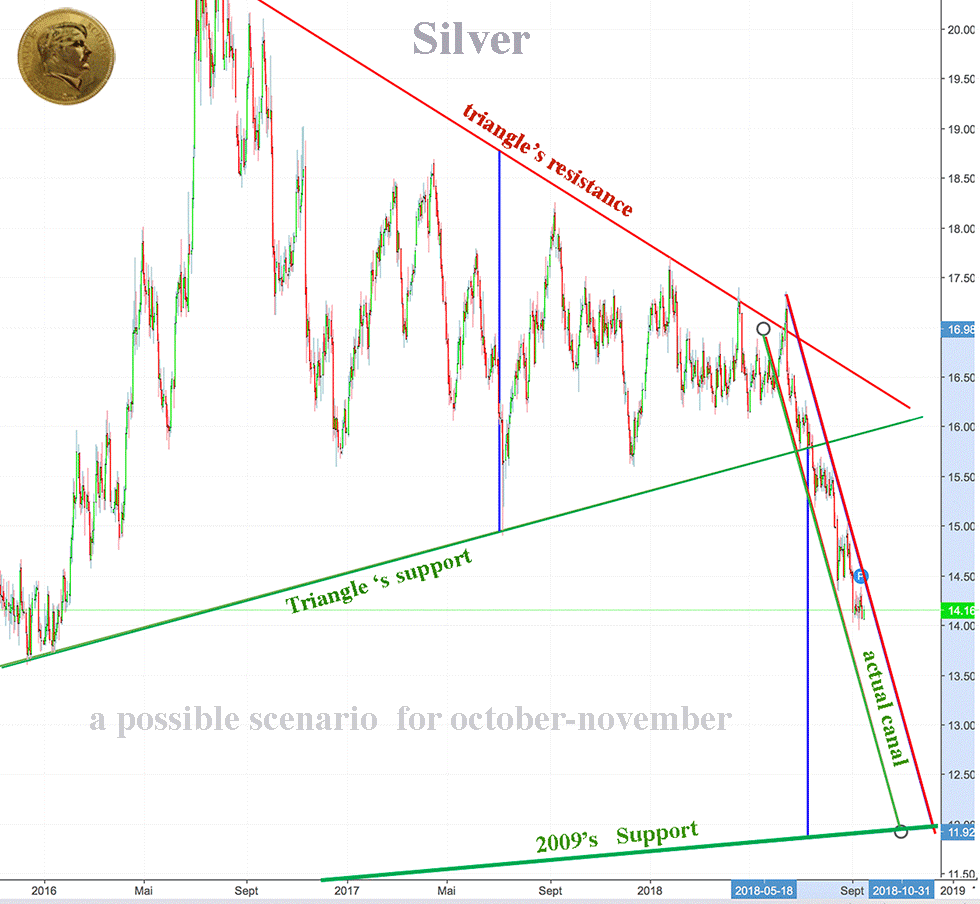
On the daily chart, you can see that silver is moving in a channel.
I think that silver slide won’t stop at $13.73. It will go lower.
On the chart underneath, you can see that silver had been tightly closed in a triangle since 2016. We were hoping that prices will get out of this triangle upwards, but it went downwards.
Therefore, you can calculate the aim of this leg, with the height of the triangle, the first time, the support had been re-tested.
Statistically, silver is going to test the old support again.
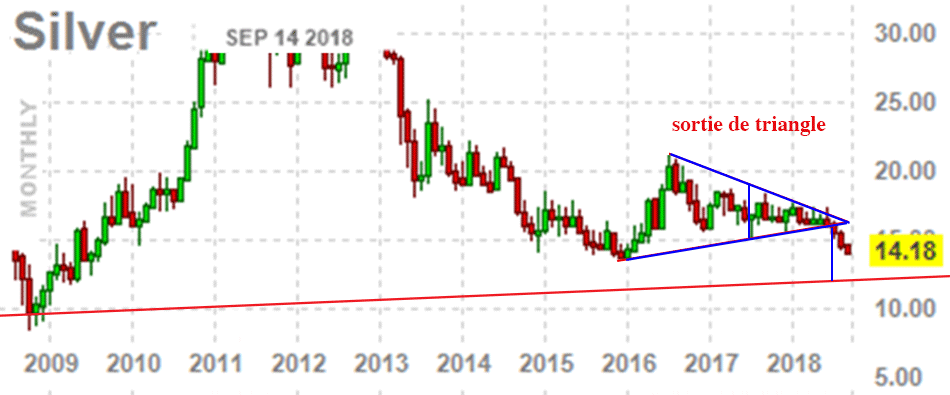
A chart of better quality would tell you that silver could reach the 2009 support around $11.92 between October 31 and December 3rd.
At what price will the mining companies decide to stop selling their physical silver? What will happen then? Will the COMEX Rule N° 589, which entered into force on December 22, 2014, be applied?
China had been cornering the gold and silver physical market for 7 years. Its aim is not to let the gold/silver ratio at 1/85.



Leave A Comment