Talking Points
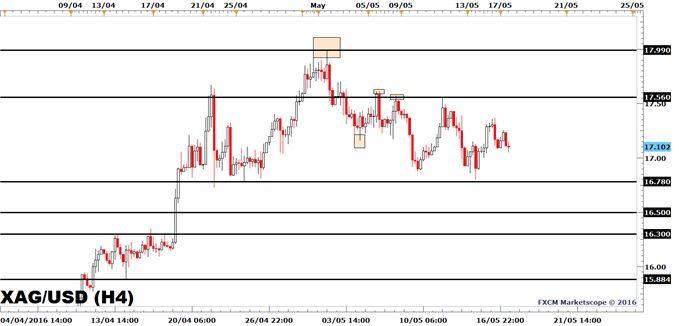
Silver prices were little changed at the time of writing and stayed firmly trapped between the April 25 low of $16.78 and the May 11 high of $17.56.
As long as price is trapped in a range, traders tend to have a low tendency to take action, as price does not have a clear direction. Consequently, it is common for the range to narrow further and wait for a breakout. On a breakout occurring, it may be the start of a new trend, especially if macro fundamental news triggers the break.
Support levels below the lower end of the range, are the psychological level of $16.50, followed by the March 18 high of $16.30. Resistance levels above May 11 high of $17.56 are the May 5 high of $17.70, followed by the May monthly high of $17.99.
Silver Price | CFD: XAG/USD

Created with Marketscope/Trading Station II; prepared by Alejandro Zambrano
Potential market moving events in today’s session are U.S. Inflation and Industrial Production. Headline inflation may rise by 1.1% YoY from 0.9% in March, while the Core Inflation annual growth rate may decline to 2.1% from 2.2% as per a Bloomberg News survey. The trends of these series are important as rising inflation readings may force the Fed to hike rates over the next 12 months; this may support a stronger dollar and thereby weaken silver prices. The opposite is also true: a slower pace of inflation may reduce the demand for the USD.
U.S. Industrial Production may rise by 0.3% MoM, which follows a contraction of 0.6% in March according to a Bloomberg News survey. Since last year, Industrial Production contracted by 2.0% in March, which is the same annual growth rate as in November, while the low of the current downtrend is the December growth rate of -2.30%.


Leave A Comment