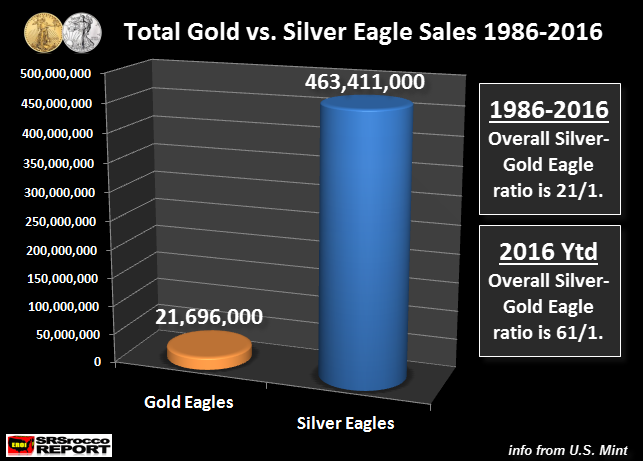
What is the better investment? Silver or Gold? Well, if we look at the following two charts below, we can spot some interesting trends. The U.S. Mint has been producing Gold and Silver Eagles for over thirty years now. Since 1986, the U.S. Mint has sold 21.7 million Gold Eagles versus 463.4 million Silver Eagles. The overall Silver-Gold Eagle Ratio from 1986-2016 is 21.1:

However, if we look at the Gold Eagle sales of 252,500 oz versus Silver Eagles at 14,842,500 for 2016, the ratio is 61/1. Investors are currently buying Silver Eagles this year at three times the historic overall ratio. Furthermore, if we break down Gold versus Silver Eagle sales in the following two periods, we can see an interesting trend:

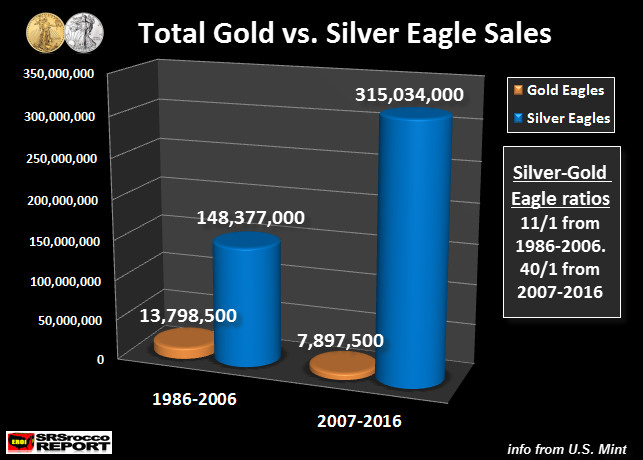
From 1986-2006, the U.S. Mint sold a total of 13.8 million Gold Eagles compared to 148.3 million Silver Eagles. This 21 year period that took place before the collapse of the U.S. Investment Banking and Housing Markets, shows that investors favored buying Gold Eagles more than Silver Eagles as the Silver-Gold ratio was only 11/1.
However, this changed after 2007, when investors bought a massive 315 million Silver Eagles versus 7.9 million Gold Eagles. During the 2007-2016 period, the Silver-Gold Eagle ratio jumped nearly four times to 40.1. In addition, total Gold Eagle sales were less in the second period, but Silver Eagle sales were more than double (148.3 million vs. 315 million).
Here is another interesting statistic.Let’s compare Gold and Silver Eagle sales versus the total inventories at the GLD and SLV ETF’s:
Gold & Silver Eagles vs. GLD & SLV ETF’s (million – Moz):
Total Gold Eagles = 21.7 Moz
Total GLD inventories = 26.5 Moz
Total Silver Eagles = 463. 4 Moz
Total SLV inventories = 330 Moz
What is interesting is that there are more Silver Eagles held in private hands (463.4 Moz) than the total inventories on the SLV ETF (330 Moz). On the other hand, there is more gold (supposedly) held at the GLD ETF (26.5 Moz) compared to the Gold Eagles held by the public (21.7 Moz).


Leave A Comment