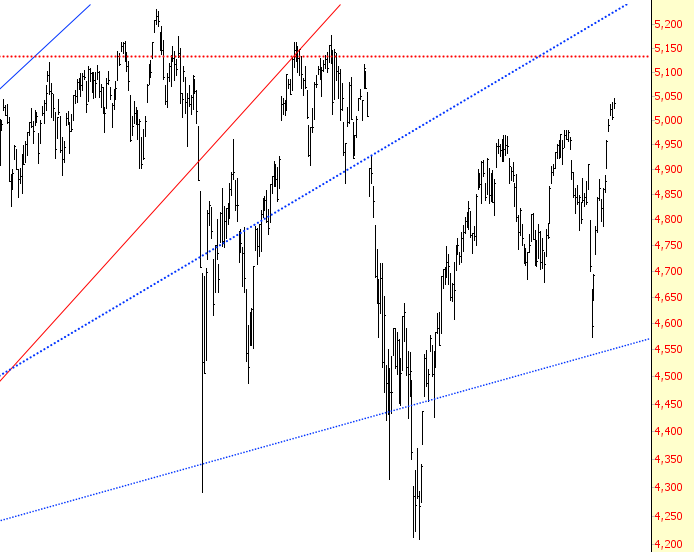
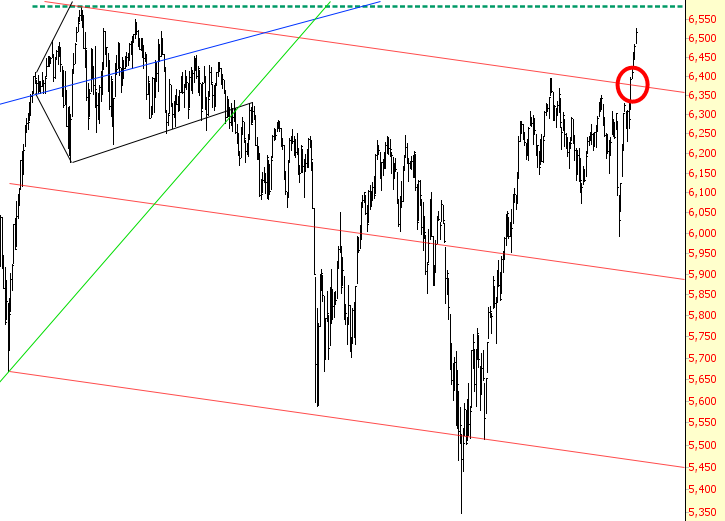
The market – if you want to still call it that – can be broken into two camps these days. One camp is completely dominated by the bulls. In short, they’ve won. Trendlines have been broken to the upside, and there is absolutely nothing about the behavior of the charts to suggest anything but a near-endless series of new highs.
The other camp has been recovering, to be sure, but isn’t in the hands of the bulls (yet, at least). The topping patterns are still in place, or at a minimum, there hasn’t been any breakout.
I wanted to share a sampling of these two groups to give you a sense as to this dichotomy. First, here are the “bulls are large and in charge” collection, beginning with the Dow Jones Composite.

The Dow Industrials:

The S&P 100:

The Major Market Index:

Finally, the S&P 500:

And now, for balance, here are charts which have not been broken and, in some cases, can still be considered bearish. The Nasdaq Composite:

The Nasdaq 100:

The Russell 2000 small caps:

The Dow Transportation Index:

The broker/dealer index:

And, my personal favorite, the oil/gas sector index:


Leave A Comment