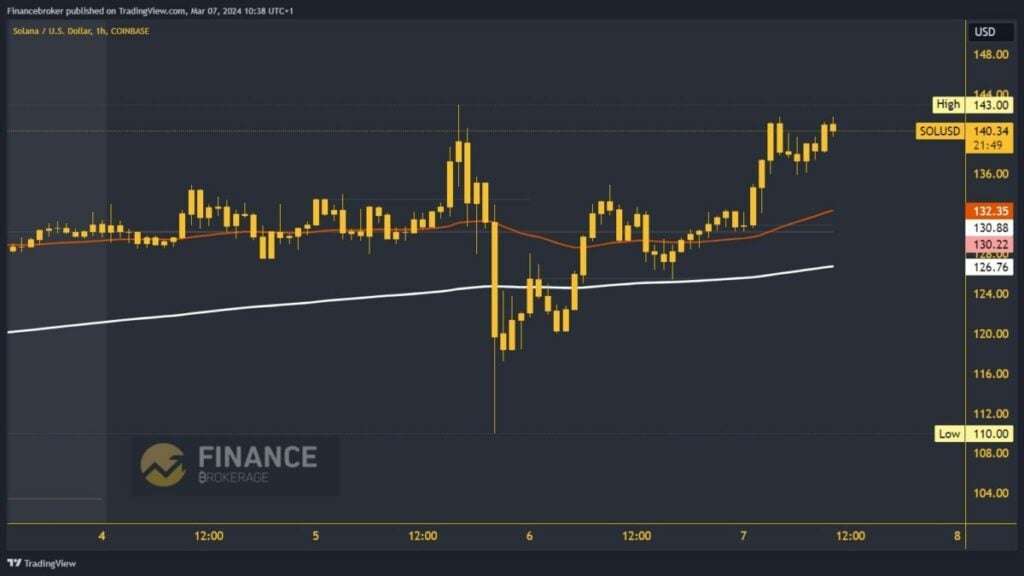
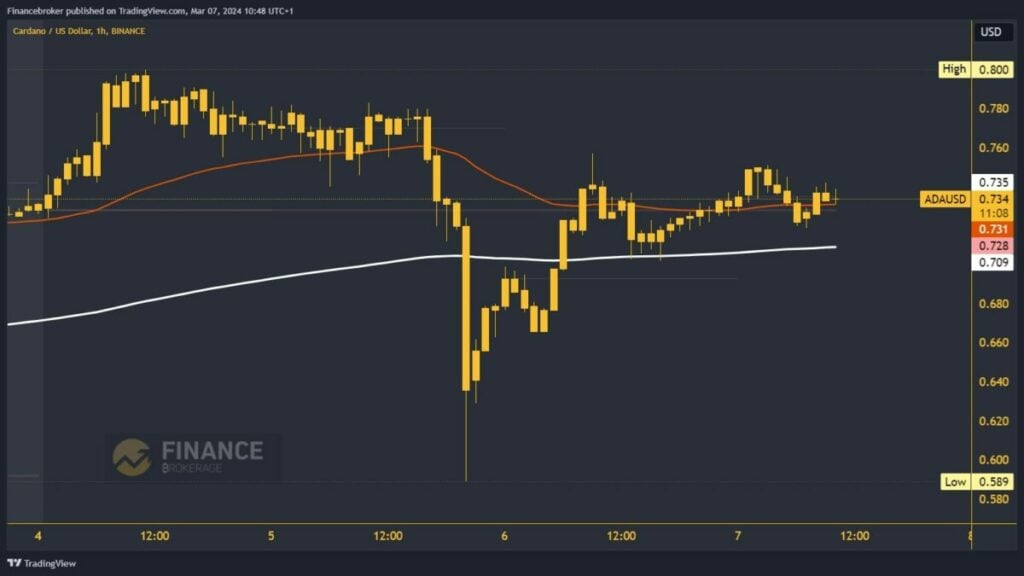
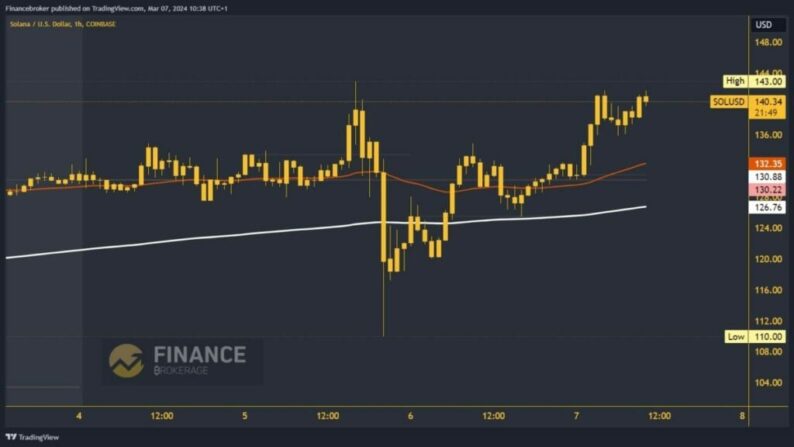
Solana chart analysisToday, we see Solana’s price again above the $140.00 level, and we are very close to testing the previous high at the $143.00 level. We need another impulse to make it happen. The price is on a good run and could do so by the end of the day. Potential higher targets are $144.00 and $145.00 levels.For a bearish option, the price of Solana would have to drop below the $136.00 level. We break through the previous support zone. There is increasing pressure on the price to take a new bearish step. Below, we look at the $132.00 level as further support; that level is the place where the previous bullish impulse was broken. Potential lower targets are the $130.00 and $128.00 levels. Additional support for Solana in the $128.00 zone is the EMA200 moving average.  Cardano chart analysisCardano’s price is in a two-day bullish consolidation. This morning’s price high was at the 0.750 level, after which we saw a pullback to the 0.720 level. There, we formed a daily low and continued on the bullish side. We are currently at the 0.7350 level, and we need a new impulse to push us to test this morning’s high. If we manage to break the above, it will be much easier for us to start further recovery.Potential higher targets are 0.760 and 0.770 levels. For a bearish option, the price of Cardano would have to first drop and test the EMA200 support at the 0.710 level. A break below means we don’t have the strength to recover and will be looking at a pullback to a new lower low. Potential lower targets are 0.680 and 0.660.
  More By This Author:China’s 5% Economic Growth Target: A Path Through ChallengesOil And Natural Gas: Natural Gas At $1.90 Support Level Today’s Ethereum Price Target Is Above The $3900 Level


Leave A Comment