
Is it time to panic?
After about 20 months of essentially unfettered gains, the S&P 500 has gone backwards pretty sharply in the past week. Since the close on Thursday, Feb. 1, the SPY ETF (which tracks the S&P 500) has declined 7.1%, seeing some of its largest single-day declines in over 5 years.
Occurrences like this can be unsettling for investors, but in this article, I wanted to share some thoughts on the declines, put them into perspective, and offer some opinions on where we go from here.
Putting It Into Perspective
Major financial publications have been touting recent declines in the Dow as “the largest one-day drop since the Great Recession”, “the worst point decline in history”, and “the largest one-week drop in 9 years”.
All these may be true, but I prefer to look at the S&P 500, a better barometer for the overall stock market. The Dow tracks only 30 stocks – less than 10% of the S&P 500. Measured by market cap, the Dow tracks about $6.7 trillion, less than 1/3rd of the S&P 500’s $24 trillion. Essentially all mutual funds, ETFs, hedge funds, and newsletters (including ours) benchmark against the S&P, not the Dow.
That said, the S&P 500 has declined over 7% since the start of February. Is this a sign of major declines to come?
First of all, let’s take even a slightly larger perspective. Even after this decline, the S&P 500 is down about 2% in 2018 – hardly disastrous. After a nearly 20% gain in 2017 and a nearly 50% gain in the preceding two years, a flattening out or even a slight decline in the averages could be considered natural, even healthy.
The recent drop’s magnitude isn’t even particularly notable when put into recent history.
Consider the S&P 500’s incredible performance since 2010. The index is up an impressive 135% since the beginning of 2010. But in those 7+ years, the index has seen no fewer than 7 declines larger than this one within periods less than a month. Many of them have been far bigger declines than this one. Consider:

Related Posts
 Kakao’s Klaytn expands NFT offerings to OpenSea following 800% quarterly growth
 Bear Of The Day: CNX Coal Resources
- Piper Reiterates Sell On PayPal With Apple Expanding Into Mobile Payments
 Economy Would Grow Faster With Trump Tax Plan: Be Ready For Stronger Sales
 United Airlines Flunks Economics 101
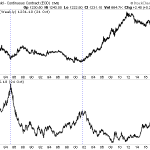 Stronger Dollar Is Bullish Catalyst For Gold


Leave A Comment