Oil prices have bounced back a lot, despite recent softer price action that sees crude near $60.
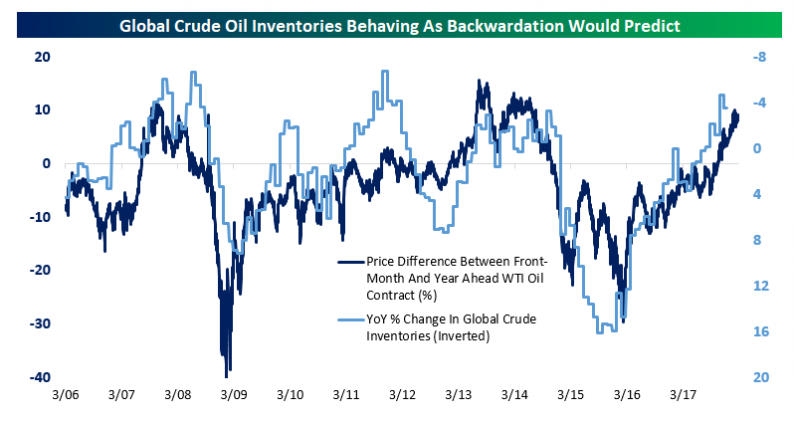
That’s put near-month crude at a hefty premium to out-months, a so-called backwardation of the WTI curve. As shown in the chart below, the ~10% premium for front-month over year-ahead crude is about as high as it’s gotten over the past decade or so. The price differential provides a huge incentive for investors to supply crude to the market by selling spot crude and buying out-months. That creates a positive yield.
The opposite was true in the period when the WTI curve was in contango; investors had an incentive to buy spot and sell out-months, driving up inventories. As shown in the chart below, while inventories and the shape of the crude curve are not perfectly correlated, they’ve got a very close relationship. As long as out-months remain at a discount to the front of the curve, don’t be surprised to see global stockpiles continue to shrink.


Leave A Comment