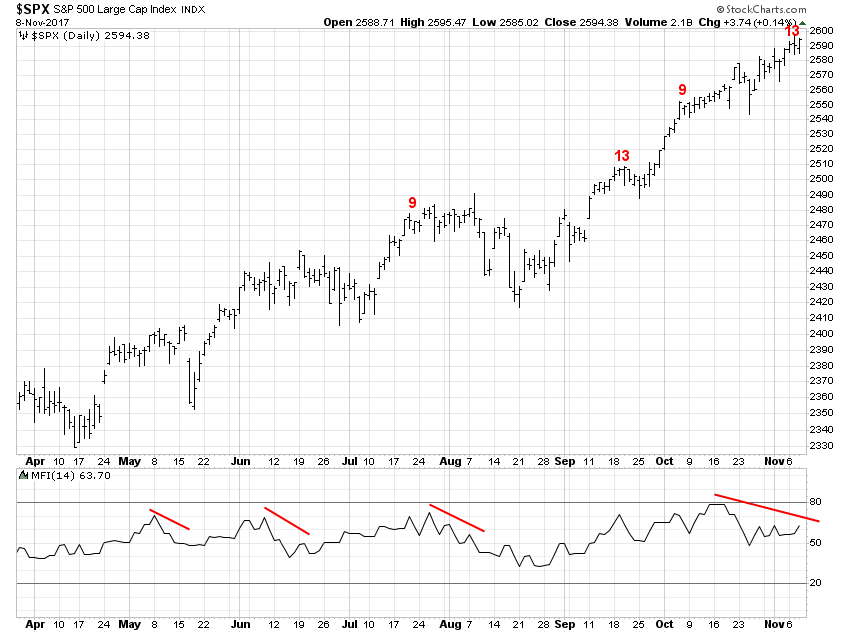
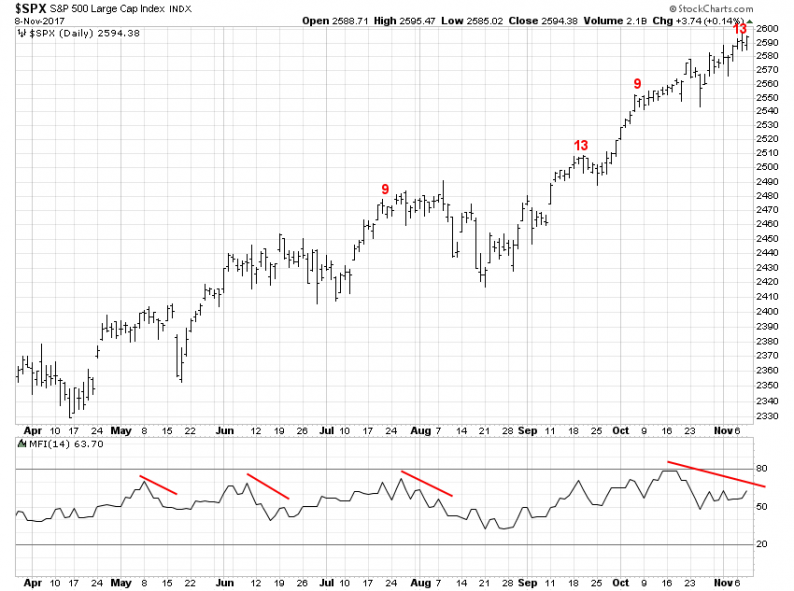
The SPY ETF completed yet another DeMark Sequential sell signal on the daily chart yesterday. It also has a potential bearish divergence in money flow forming, as well.
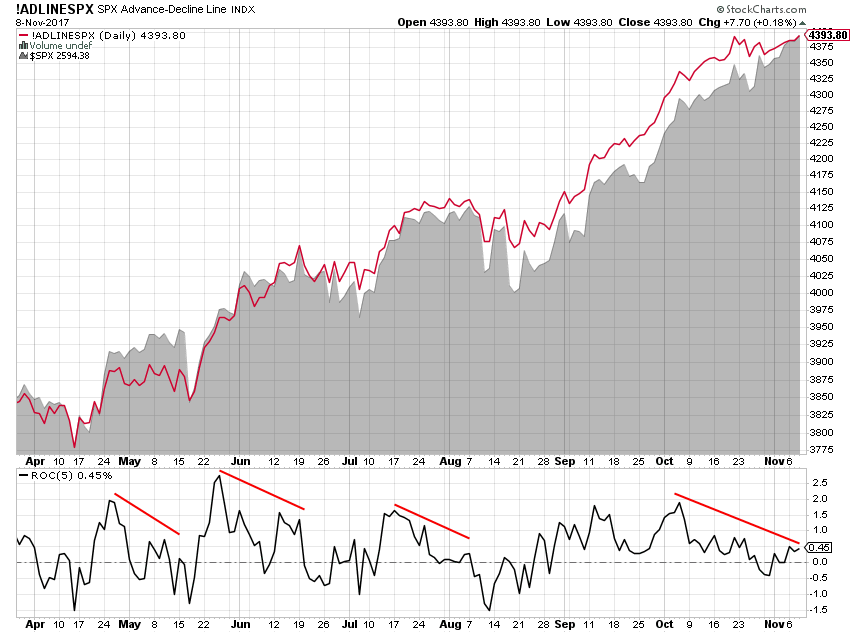
But what interests me more than the technicals right now are the internals. The advance-decline line has flattened out over the past few weeks even as the S&P 500 has continued to power higher. The 5-day rate of change at the bottom of the chart also shows a significant divergence.
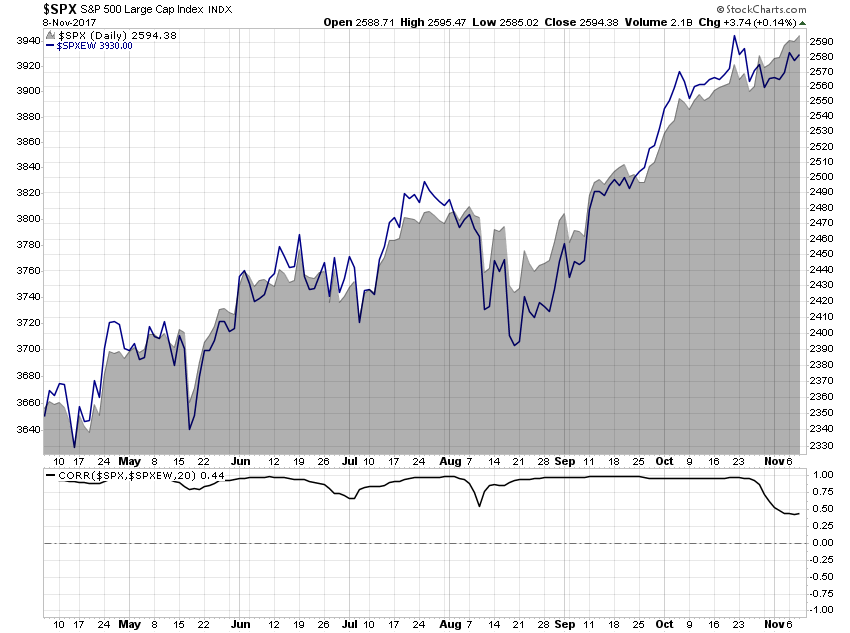
The equal-weight version of the index has failed to confirm the new highs in the more popular cap-weighted index. The average stock is not making new highs right now.
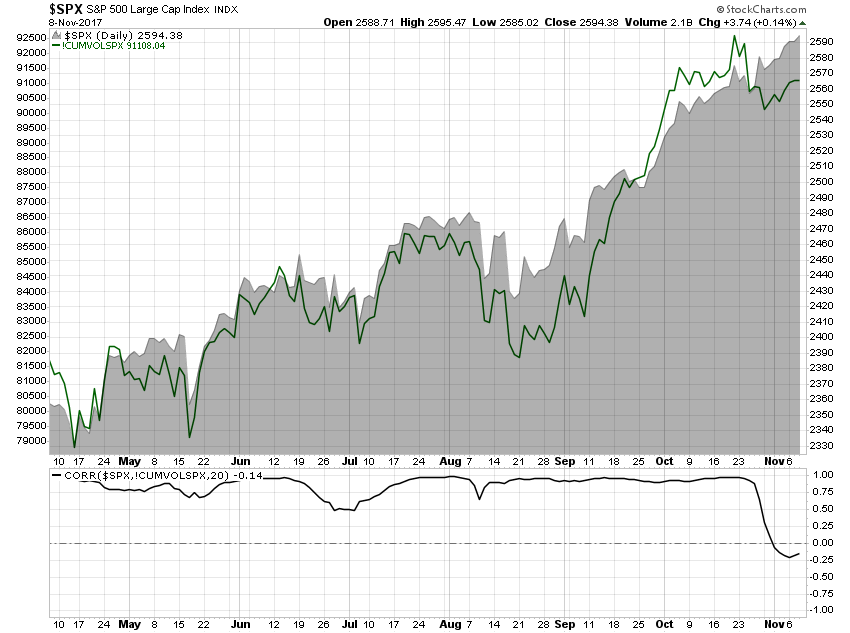
Cumulative volume shows an even greater divergence with prices right now. While it might not look like much this is the largest divergence in the past 20 years.
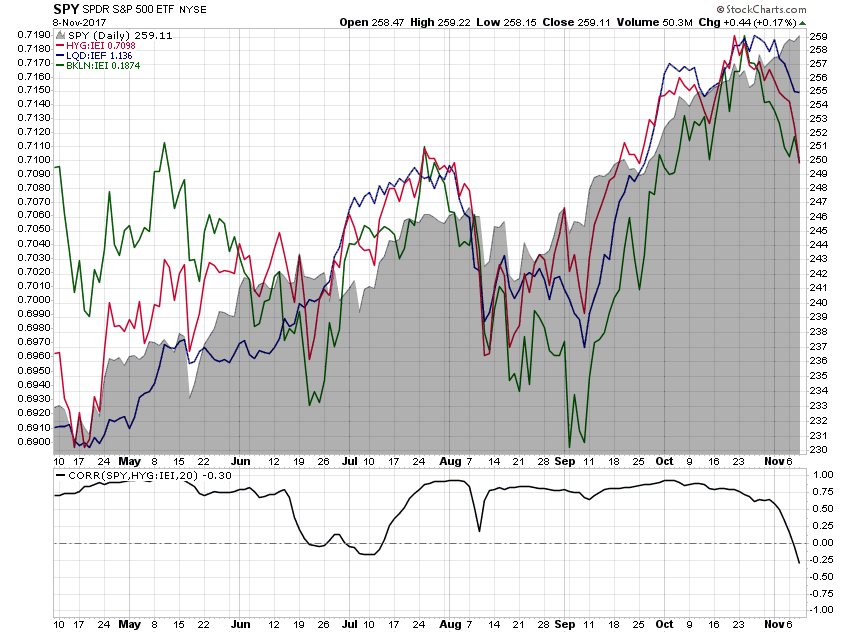
In addition, bond market risk appetites are rolling over.
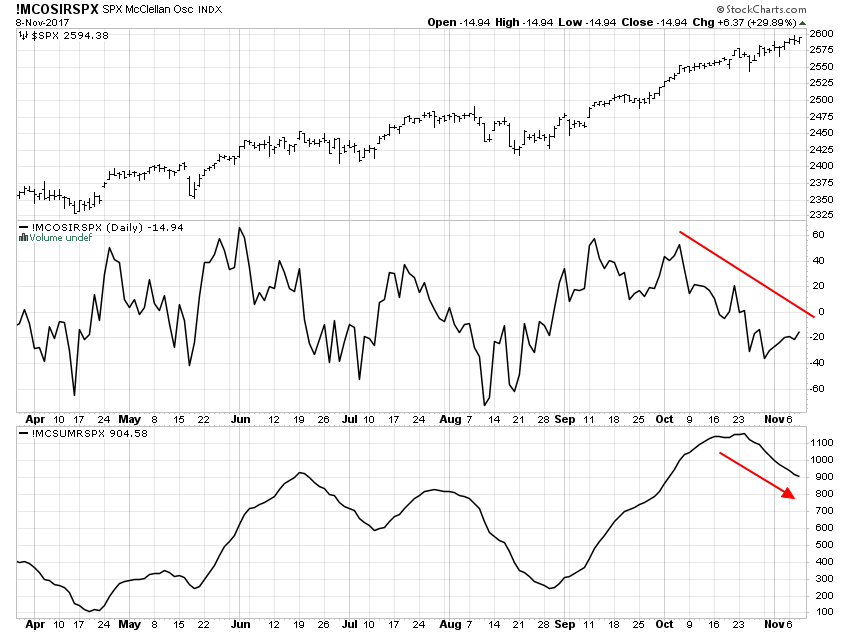
At the same time, the McClellan Oscillator is diverging from the S&P 500 and the Summation Index has also rolled over, indicating that the average stock has been falling lately rather than rising alongside the index.
Individually, these divergences might not mean much but when they all line up like this it suggests there’s a high probability of an imminent reversal for the major indexes.



Leave A Comment