Written by Robert McHugh (TechnicalIndicatorIndex.com)
We believe markets are lining up for a major top later in 2017, possibly in the August to October time period. There are several patterns we are watching that lead us to this conclusion.
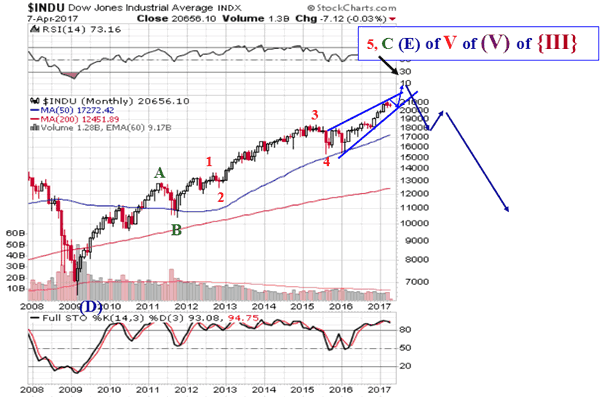
First let’s take a look at our first chart, a Rising Bearish Wedge termination top pattern.

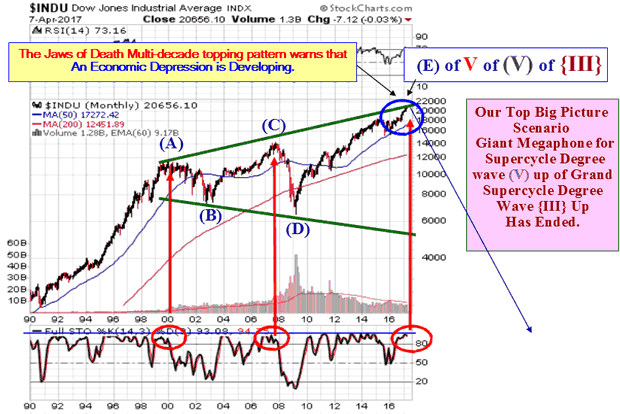
The Rising Bearish Wedge since August 2015 is finishing a multi-decade Jaws of Death pattern, and a multi-century Bull market. This five wave Rising Bearish Wedge (a-up, b-down, c-up, d-down, e-up) has likely finished the first three of the five subwaves, and the decline since March 1st, 2017 is wave d-down, with another downleg to complete d-down likely in the next month or so…
A final rally leg toward 22,500 in the Industrials should conclude the Bull market, perhaps around the August /October 2017 time period. This upside target is based upon the likelihood markets rise to a normal overthrow above the rising upper boundary trend-line shown above.
We should see considerable Bearish divergences occur as stocks climb in their final wave e-up, perhaps divergences between tech indices and Blue Chips, and most likely a divergence between the NYSE Cumulative Advance/Decline Line and Blue Chip stock averages.
This Rising Bearish Wedge is the final move for Wave (E), which was the Bull market that started at the end of the Great Recession in March 2009.

The March 1st top gives us two definitive touch points for the upper boundary of the Rising Bearish Wedge, to go with three definitive touch points already in place for the lower boundary.
Rising Wedges are patterns that see convergence over time between the upper and lower boundary lines, and are larger degree stock market trend termination patterns, often seen at tops.

The big picture is shown above. The Bull market from 2009 is wave (E), the final rally leg of a Megaphone or Broadening Top pattern, a.k.a. a Jaws of Death pattern. Wave E’s usually extend, tracking along the upward sloping upper boundary.


Leave A Comment