Thoughts
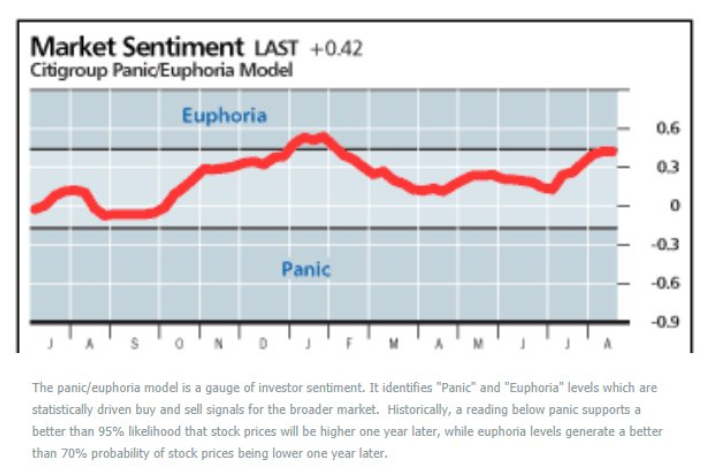
1 am: Citigroup’s Panic/Euphoria Model registered “euphoria” last week. Not as bad as you think it is, but watch out if this reading persists for a few months.
Citigroup publishes a Panic/Euphoria Model (sentiment indicator). It just registered a “Euphoria” reading last week for the first time since January 2018.

Data for this indicator is hard to find, which means that I’m unable to do quantitative market studies on this indicator. However, you can see from Citigroup’s own description that this is more useful as a BUY signal (when there’s “panic”) than as a SELL signal (when there’s “euphoria”).
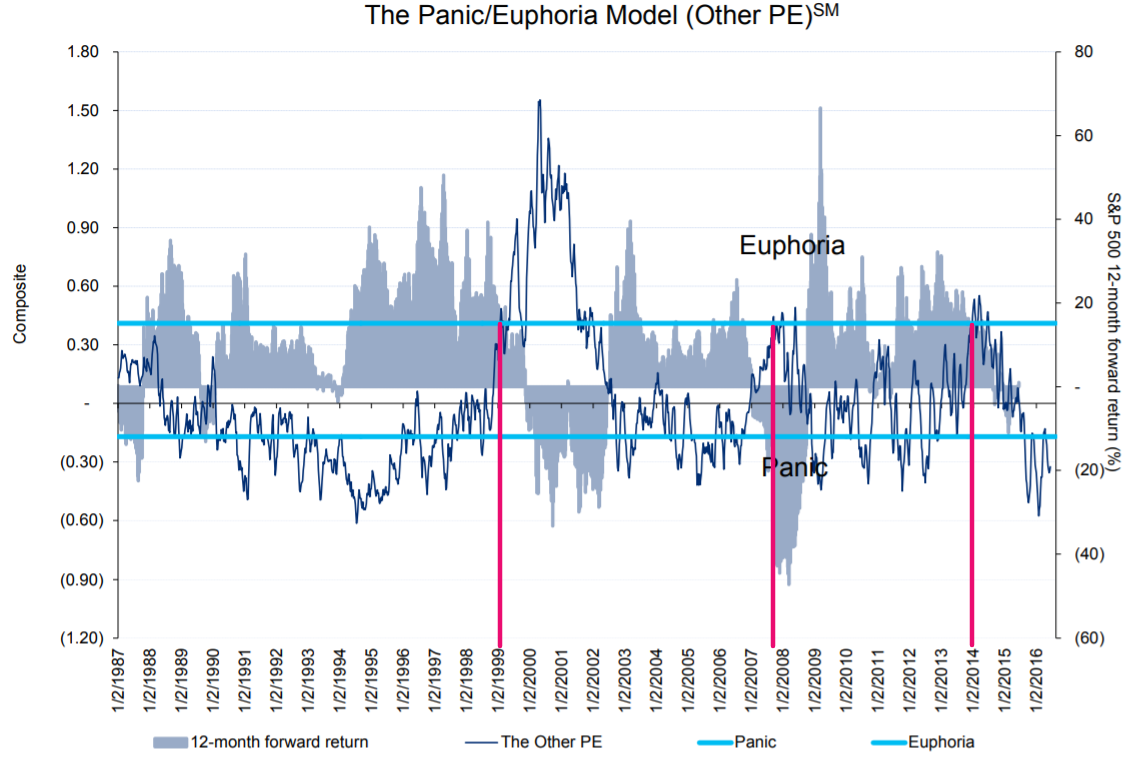
Finding historical charts on this indicator is also pretty hard, but I’ve managed to find the following.

As you can see, the Panic/Euphoria model tends to turn bearish too early.
The Panic/Euphoria model first registered “euphoria” in December 2017, and has now registered “euphoria” again. The key point is that you should wait for multiple months with “euphoria” readings. If the model keeps registering “euphoria” throughout the rest of 2018, then the stock market will probably make an important top in 2019.


Leave A Comment