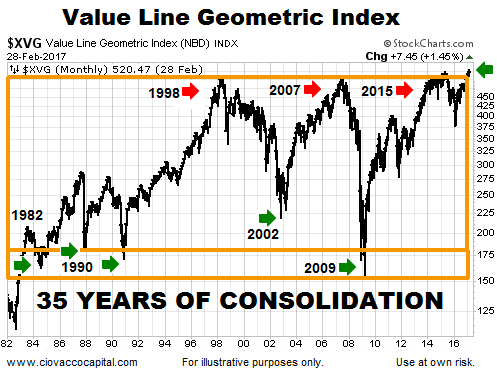
Stocks Inside Box Since 1982
The Value Line Geometric Index is a broad, equally-weighted index that can be used to monitor the health of the stock market beyond the capitalization-weighted S&P 500.
As shown in the monthly chart below, the orange box acted as both support (green arrows) and resistance (red arrows) several times between 1982 and 2016. At the end of February 2017, the Value Line Geometric Index closed above the orange box; a potentially bullish development from a long-term perspective.

The concept of consolidation, or a rectangle, as outlined on StockCharts.com:
Rectangles represent a trading range that pits the bulls against the bears. As the price nears support, buyers step in and push the price higher. As the price nears resistance, bears take over and force the price lower. Nimble traders sometimes play these bounces by buying near support and selling near resistance. One group (bulls or bears) will exhaust itself and a winner will emerge when there is a breakout.
35 Years May Be Significant
From a longer-term perspective, if the breakout holds, the length of time the Value Line Geometric Index spent inside the box could be very significant. From StockCharts.com:
Generally, the longer the pattern, the more significant the breakout. A 3-month pattern might be expected to fulfill its breakout projection. However, a 6-month pattern might be expected to exceed its breakout target.
Reviewing The Breakout In Detail
This week’s stock market video covers two major developments, including the long-term breakout in the Value Line Geometric Index. The coverage of the Value Line Geometric Index begins at the 6:39 mark.
Time Will Tell If The Breakout Can Hold
Since breakouts can fail, we will not know the significance, or lack thereof, of the recent push above the orange box for several weeks or months. Breakouts are often retested, which also calls for an open mind in the coming weeks.
In terms of keeping an open mind about the breakout holding, other developments, including a turn in the True Strength Index and a Bollinger Band “price surge”, also lean bullish from a long-term perspective.


Leave A Comment