Earnings Estimates Done Going Up
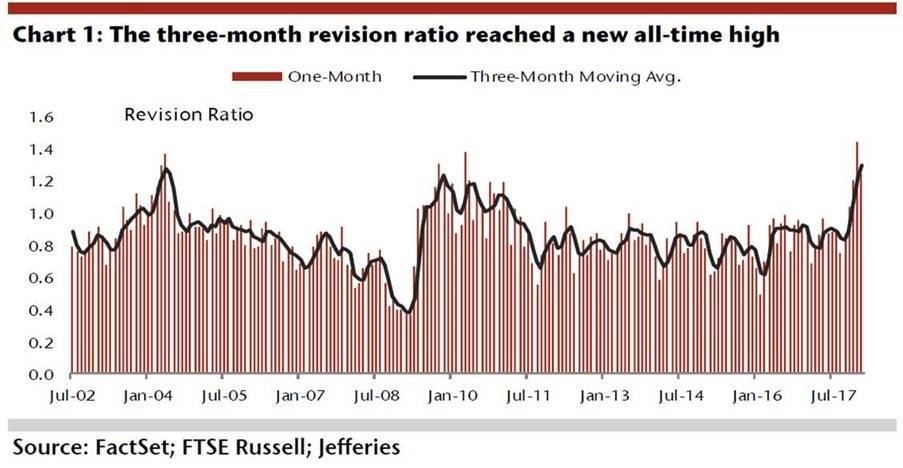
There has been a sharp multiple compression this year which makes it less likely stocks will crater. Stocks had a correction in February, but are up year to date. The compression has come from earnings estimates increasing dramatically in the past 3 months. As you can see from the chart below, the earnings revision ratio hit the highest level since at least 2002. The question investors now need to answer is whether these earnings projections were already priced in to the market before they occurred, or if the market has room to run because of them. The thesis behind the market having room to run is that it has simply been preoccupied by short term noise such as the tariffs and the short volatility trade unwinding. The stock market reacts to every news event, so its performance can be cluttered. For example, on Tuesday the market reacted to a potential denuclearization of North Korea, Speaker of the House, Paul Ryan, being fine with targeted steel and aluminum tariffs, and the President’s chief economic adviser Gary Cohn potentially resigning over this tariff discussion.

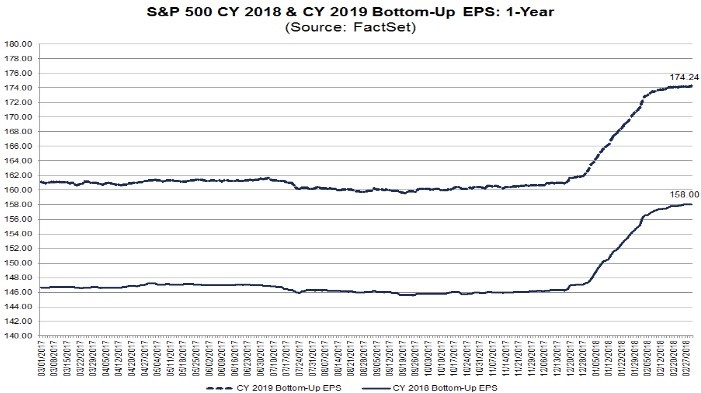
As you can see from the chart below, the 2018 and 2019 earnings estimates look like they are peaking, just like I said they would last week. Unless there’s an unforeseen boost in growth later this year, I see $160 or higher of earnings in 2018 as almost impossible. On the other hand, I think $156 or lower in earnings is likely. Speaking of multiple compression, with these results, the 10 year Shiller PE will fall. It’s difficult to fully understand the Shiller PE because it’s not predicting a crash in 1-2 years since it’s not a short term mechanism. It could either be saying stocks will fall hard when the next recession occurs or that stocks will have a shallow bear market, but there won’t be a sharp recovery.

Next Bear Market
Obviously, you don’t want to own stocks at the beginning of a bear market. However, if you have an estimate of how much stocks can fall, you can figure out a level you’re comfortable dipping you toe in the water. The chart below comes up with an exact forecast of the size of the next bear market based on the weighting of each sector. The Shiller PE assumes sector weighting has no effect on the market’s long term performance because it believes margins mean revert. If the blended S&P 500 margins always mean revert, then it doesn’t matter what the weightings are.


Leave A Comment