The S&P 500 is hovering just above its 200 day moving average right now.
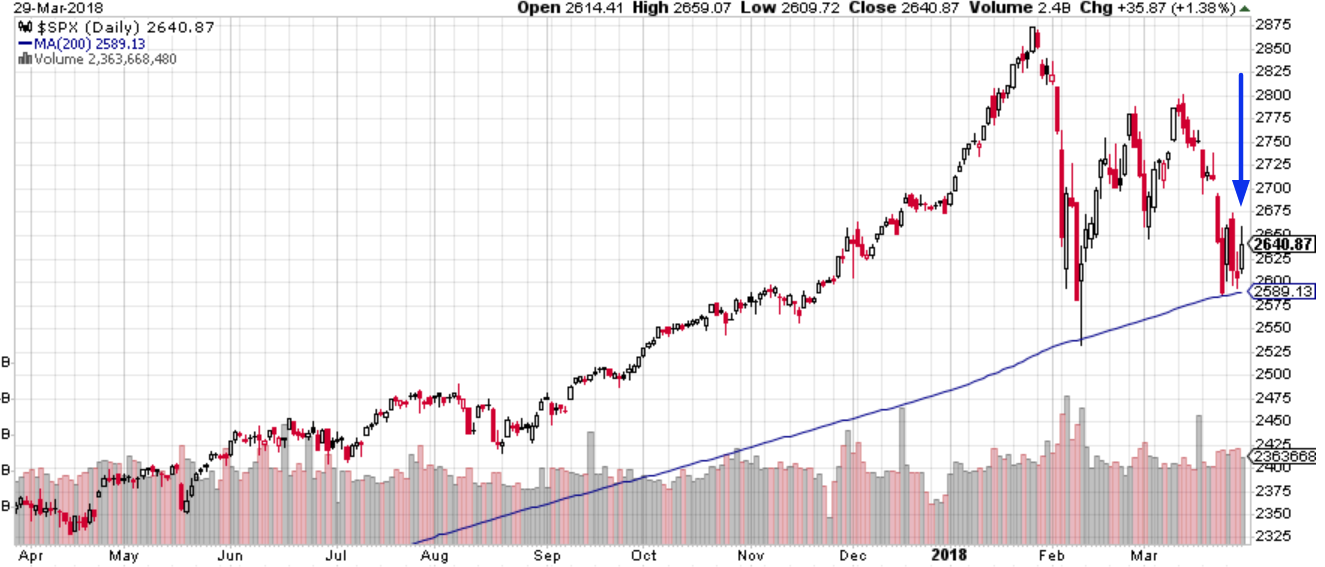
When the S&P 500 flirts with its 200 sma but doesn’t break below it, it usually breaks below this moving average soon. This is a short term bearish sign for the stock market but has no medium-long term implications. The 200sma becomes a magnet for the S&P in the short term.
Here are the historical cases when:
Here are the historical cases.
Here’s what happened next to the S&P 500.
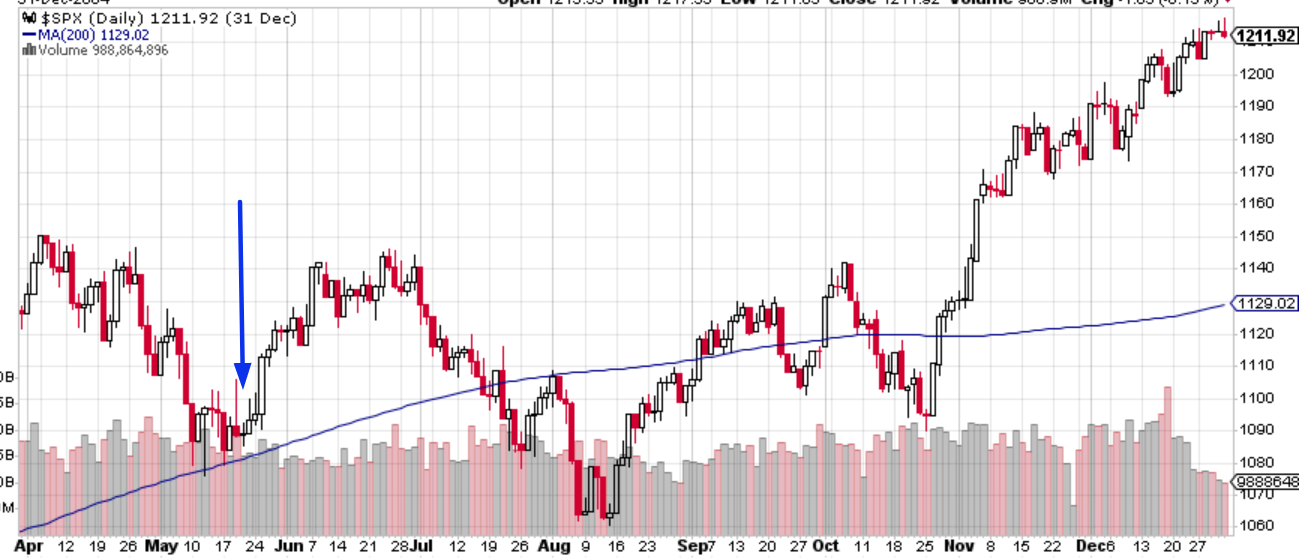
May 20, 2004
The S&P 500 bounced and then broke below the 200sma less than 2 months later.
March 4, 1994
The S&P made a small bounce and then broke below the 200sma 3 weeks later.

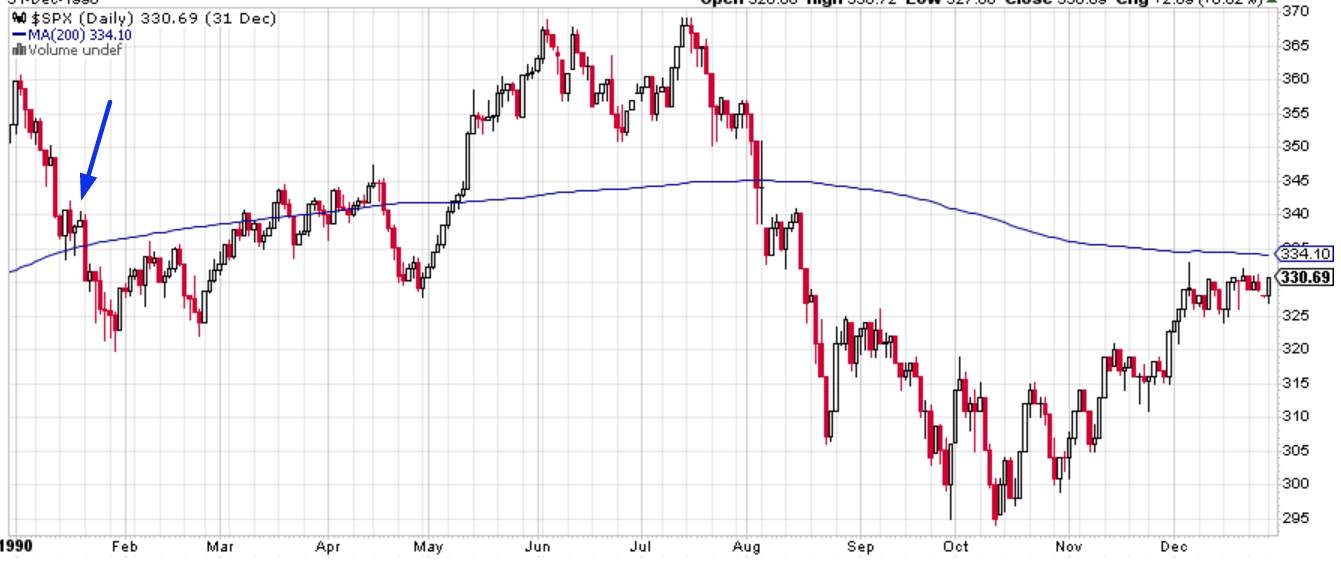
January 18, 1990
The S&P broke below the 200sma almost immediately. That was the bottom of the S&P’s “small correction”.
January 25, 1962
The S&P bounced and crashed below this moving average 2 months later.

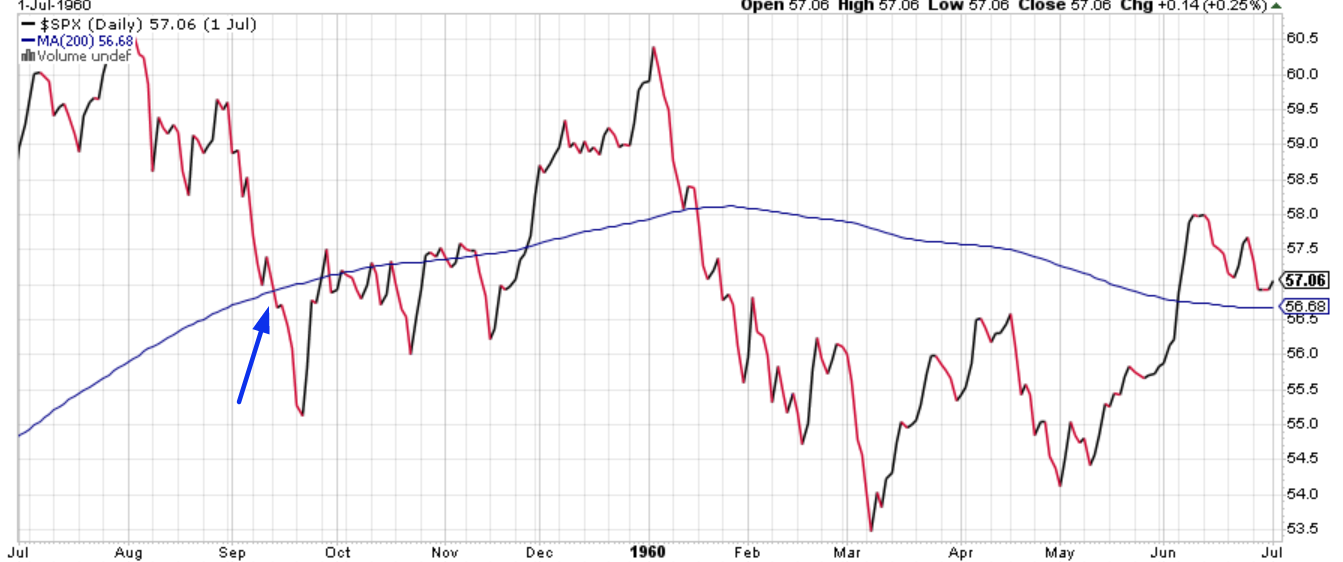
September 11, 1959
The S&P broke below its 200sma almost immediately.
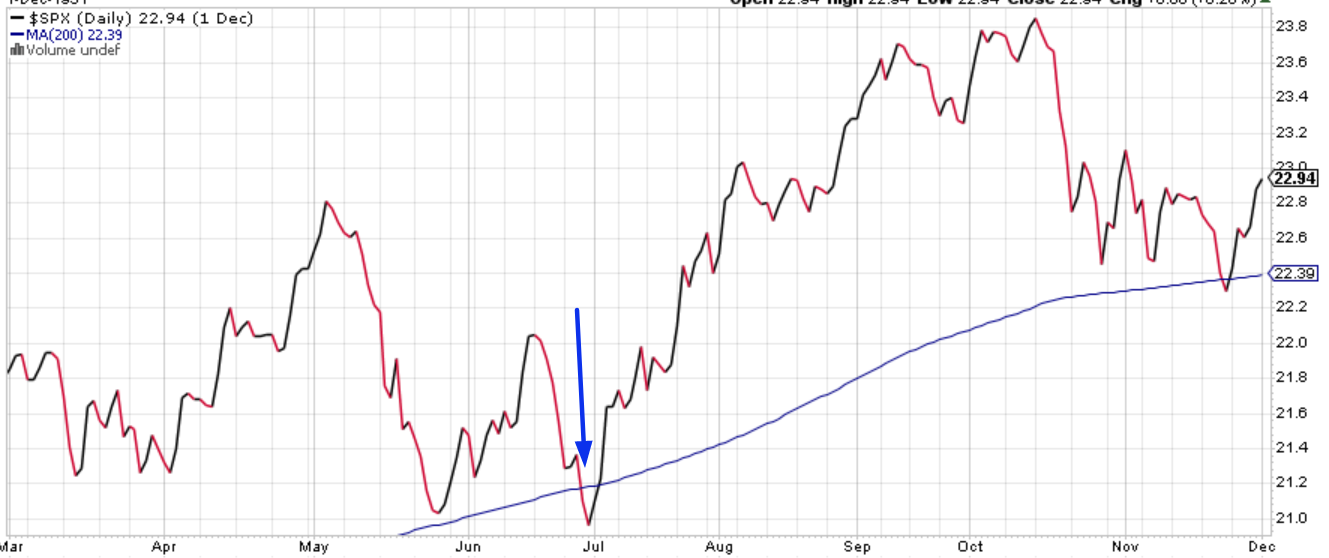
July 2, 1951
The S&P broke below its 200sma almost immediately. That was the bottom of the S&P’s “small correction”.
Conclusion
We can draw 2 conclusions from this study:


Leave A Comment