It seems that I don’t post very much on oil (or Natural Gas, for that matter). These are covered each weekend in NFTRH; but yes it’s true, I give oil and energy short shrift in public posting. Probably because I have other higher priority interests right now.
But a subscriber asked about shorting oil in light of the fading efficacy of the OPEC deal, Elliott Wave’s (I assume he means EWI) apparent target of $56 with a crash due thereafter, and Sentimentrader’s high risk sentiment reading. So let’s look into it.
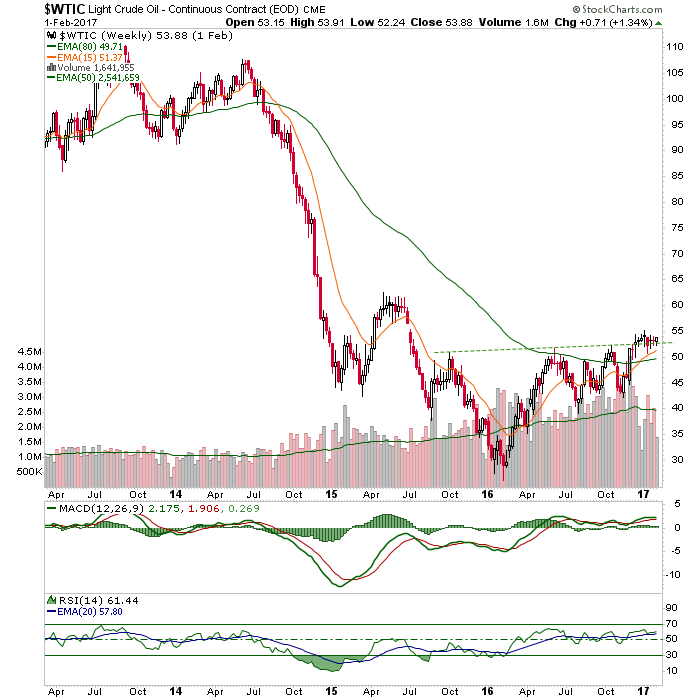
WTI Crude Oil is bullish above key support by daily chart.

WTIC weekly is in a constructive looking pattern and above the pattern’s neckline. Two moving averages have crossed for the first time since triggering a big bear phase back in 2014. When they crossed down the damage was immense. It sure can’t hurt the bullish case that they’ve crossed upward. If this pattern remains intact (i.e. WTIC above the neckline) the target is around 75.

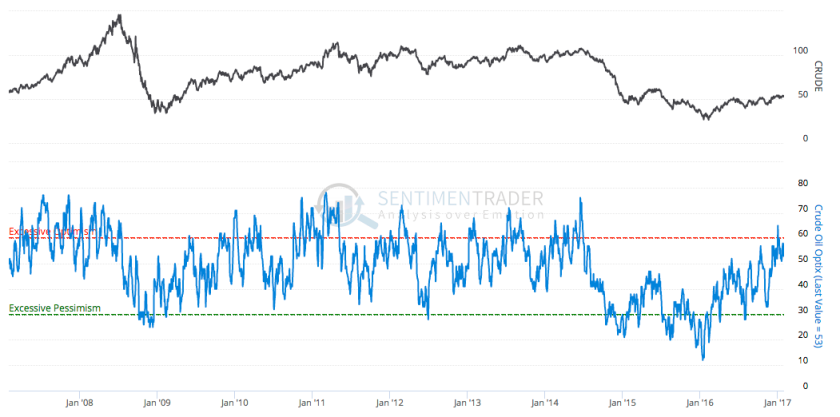
On the sentiment front, here is the above average risk per Sentimentrader‘s amalgamated data that we review each week for multiple markets.

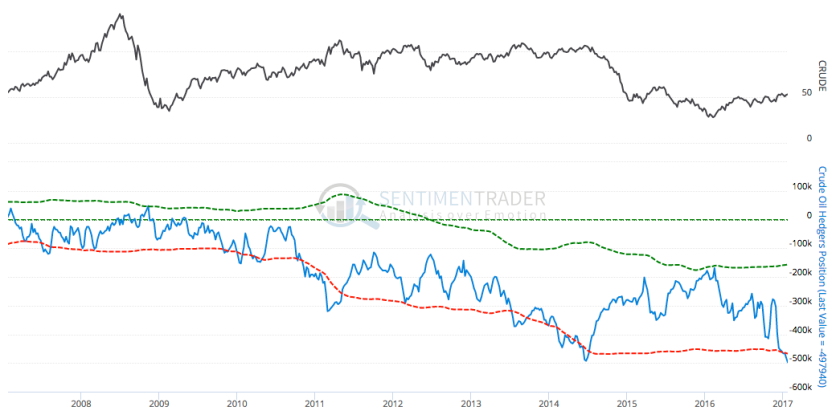
Looking more closely into the particulars, we find the Commercial Hedgers very net short this commodity. They are considered smart money.

We also find the Public to be moderately over bullish.

Neither of the two graphs above are constructive for the bullish case for oil.
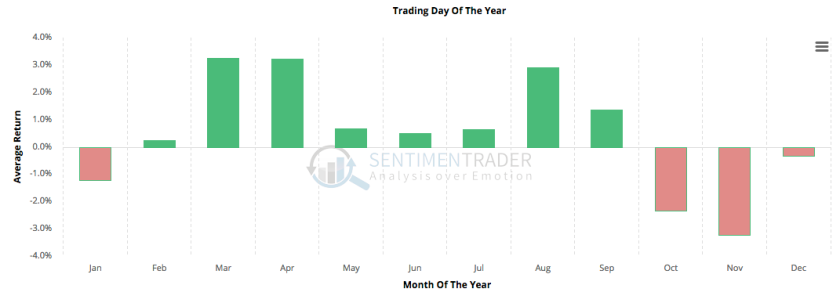
Finally, we have the seasonality for Crude Oil based on 30 years of data. This argues for the bullish case.

Bottom Line
The daily and weekly charts are still bullish. What’s more, the measured target is 75 (as opposed to Elliott Wave’s 56) if the price holds current support at the neckline. Sentiment is in a bearish alignment and seasonality is positive. From the buzz I hear, the fundamentals are a tenuous OPEC price control operation vs. high inventory levels.


Leave A Comment