
As I noted this past weekend, 2017 was a year for the record books. Not surprisingly, the strong advance fostered a surge in investor optimism which pushed allocations to equities to the second highest level on record.
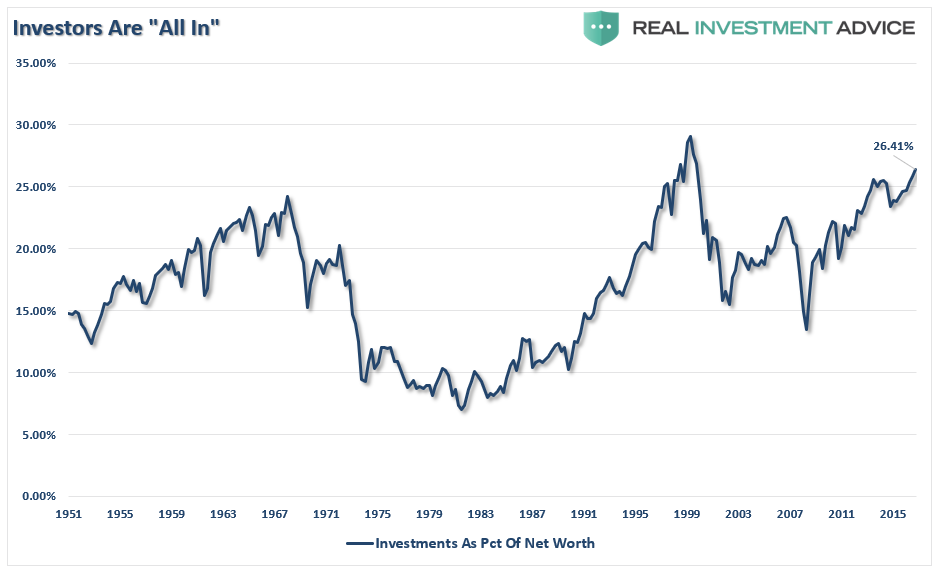
And leveraged to boot.
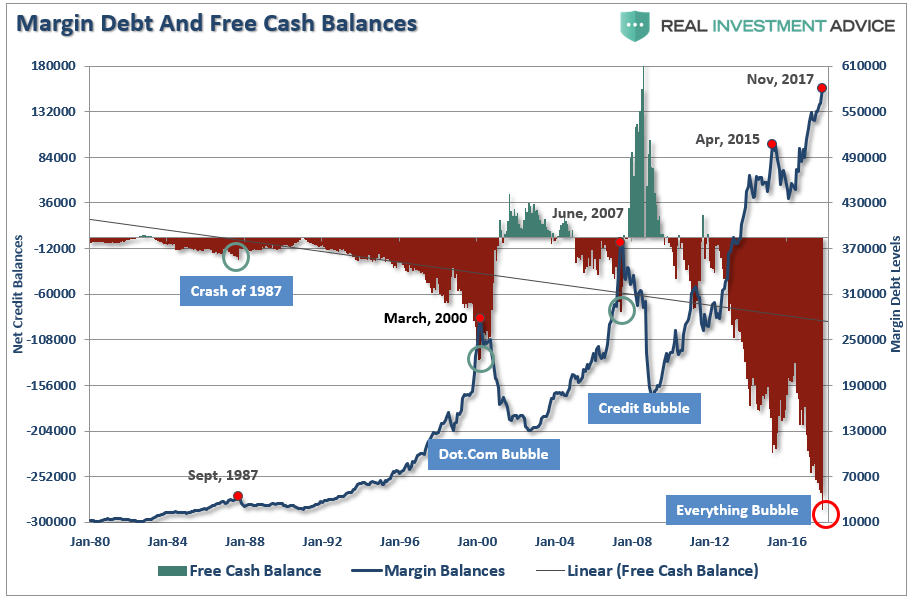
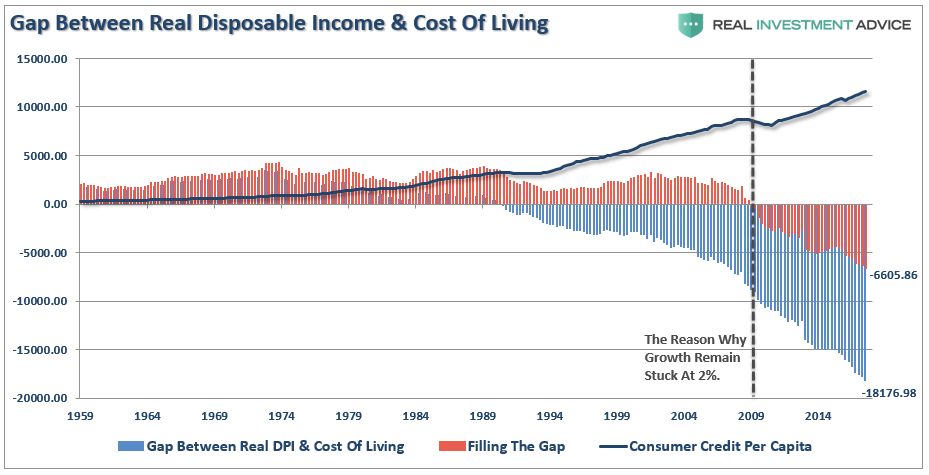
Importantly, don’t mistake record margin debt levels as people borrowing against their portfolio just to make larger investment bets. In reality, they are using leverage to support their lifestyle as well, after all, as long as stocks keep rising it’s like “free money.” Right?
This is shown in both the level of debt used to support the standard of living and the relationship between real, inflation-adjusted, margin debt and economic growth.
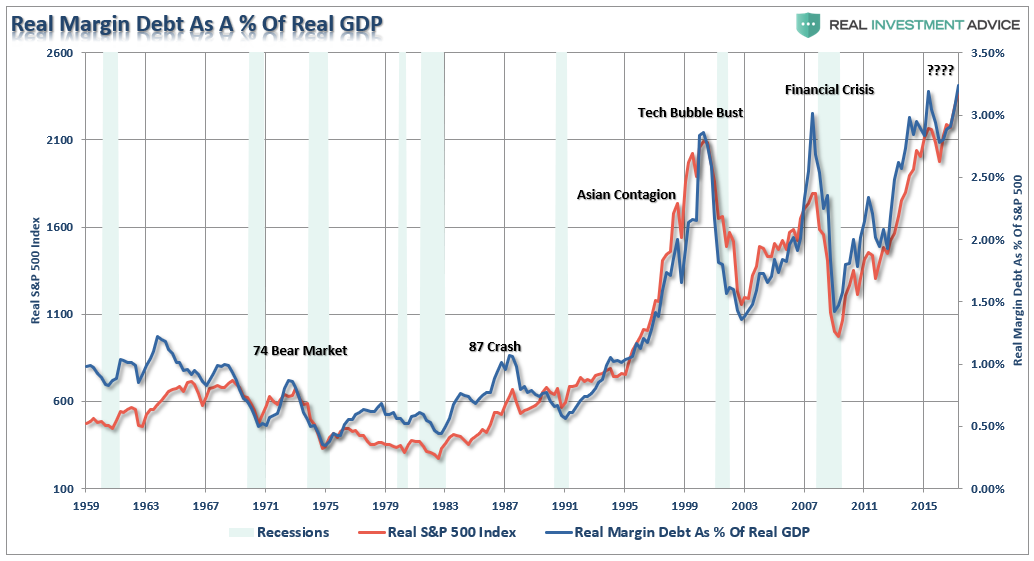
Yes. Investors are optimistic.
The current level of exuberance, and the willingness by individuals to shun risk for the hopes of chasing wealth brought to mind Bob Farrell’s 10-Investment Rules.
Particularly “Rule #9.”
I have penned these previously, but these rules should be a staple for any investor who has put their hard earned “savings” at risk in the market. These rules, which are rarely heeded in the heat of bull market, are worth revisiting as we enter into 2018.
The Illustrated 10-Rules Of Investing
Markets tend to return to the mean (average price) over time.
Like a rubber band that has been stretched too far – it must be relaxed in order to be stretched again. This is exactly the same for stock prices which are anchored to their moving averages. Trends that get overextended in one direction, or another, always return to their long-term average. Even during a strong uptrend or strong downtrend, prices often move back (revert) to a long-term moving average. The chart below shows the S&P 500 with a 52-week simple moving average.
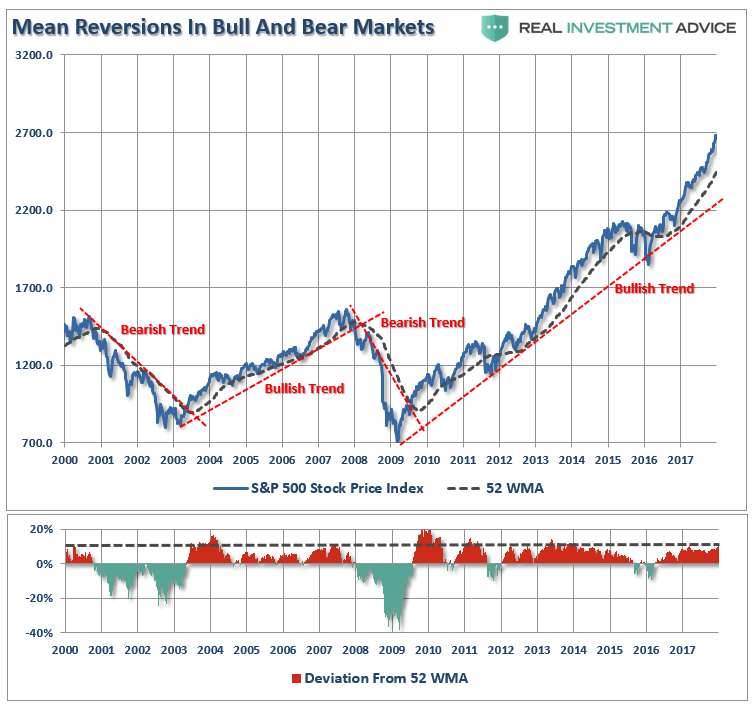
The bottom chart shows the percentage deviation of the current price of the market from the 52-week moving average. During bullish trending markets, there are regular reversions to the mean which create buying opportunities. However, what is often not stated is that in order to take advantage of such buying opportunities profits should have been taken out of portfolios as deviations from the mean reached historical extremes. Conversely, in bearish trending markets, such reversions from extreme deviations should be used to sell stocks, raise cash and reduce portfolio risk rather than “panic sell” at market bottoms.
The dashed RED lines denote when the markets changed trends from positive to negative. This is the very essence of portfolio “risk” management.
2. Excesses in one direction will lead to an opposite excess in the other direction.
Markets that overshoot on the upside will also overshoot on the downside, kind of like a pendulum. The further it swings to one side, the further it rebounds to the other side. This is the extension of Rule #1 as it applies to longer-term market cycles (cyclical markets).
While the chart above showed prices behave on a short-term basis – on a longer-term basis markets also respond to Newton’s 3rd law of motion: “For every action, there is an equal and opposite reaction.”
As I showed in “How Investors Are Dealt A Losing Hand:”
Our chart of the day is a long-term view of price measures of the market. The S&P 500 is derived from Dr. Robert Shiller’s inflation adjusted price data and is plotted on a QUARTERLY basis. From that quarterly data I have calculated:


Leave A Comment