Last week, I received the following email from a reader which I thought was worth further discussion.
“In a recent article “Signs of Excess – Crowding and Innovation” Lance stated ‘Note the chart above is what has happened to a $100,000 investment in the S&P Index. While the S&P index has soared past previous highs, a $100,000 dollar investment has just recently gotten back to even. This demonstrates the important difference about the impact of losses on a dollar-based portfolio on investments versus a market-cap weighted phantom index.” – M. Fitzpatrick
It’s a great question.
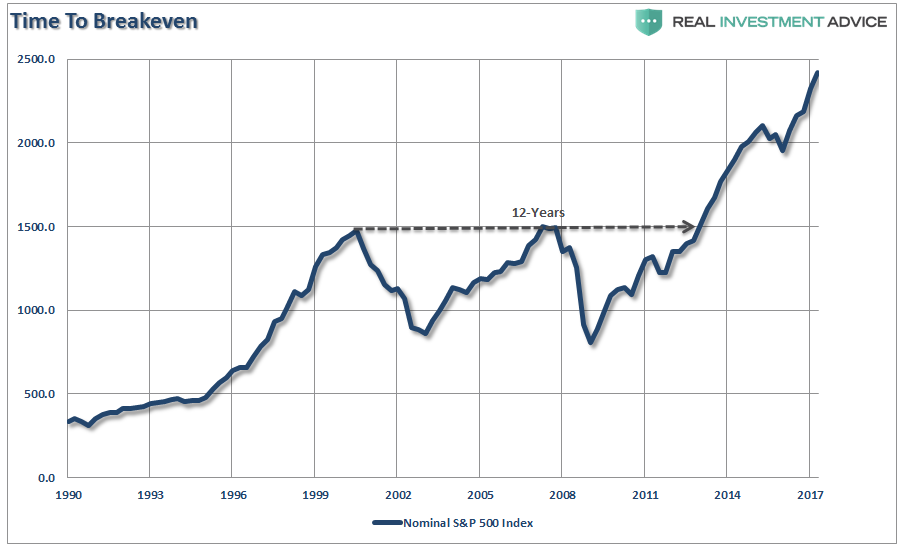
Almost daily there is an article touting the soaring “bull market” which is currently hovering near its highest levels in history. The chart below is based on quarterly data back to 1990 and is nominal (not adjusted for inflation) which is how it is normally presented to investors.

The Big Lie
The “Big Lie” is that you can “beat an index” over an extended period of time.
You can’t, ever.
Let me explain.
While individuals are inundated with a plethora of opinions on why the index is moving up or down from one day to the next, a portfolio of dollars invested in the market is vastly different than the index itself. I have pointed out the problems of benchmarking previously stating:
Furthermore, it is also not representative what happens to real dollars invested in the financial markets which are impacted by changes in inflation. The chart below compares the break even times for the nominal index versus an inflation-adjusted index and $100,000 investment into the index.


Leave A Comment