Average Stock Breakout
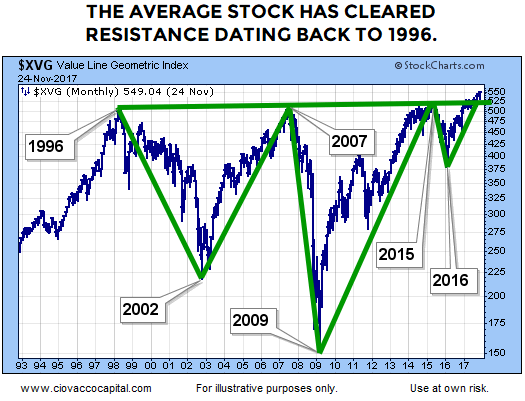
Since it is an equally-weighted and broad index, the Value Line Geometric Index is a good way to monitor the average stock. As shown in the chart below, a very long-term and bullish breakout occurred recently.

Stocks Break Out Versus Bonds
There is nothing in the stock/bond chart below that contradicts the bullish narrative told by the Value Line Geometric Index. The stock/bond ratio remains above an area that acted as resistance in 2015.

A Different Story From Longer-Term Charts?
This week’s stock market video reviews very long-term stock/bond and stock/gold charts to see what we can learn about the sustainability of bullish trends in the S&P 500. The video examines the odds of both bonds and gold providing disappointing returns relative to stocks in the coming 3 to 20 years.
Stocks Break Out Versus Gold
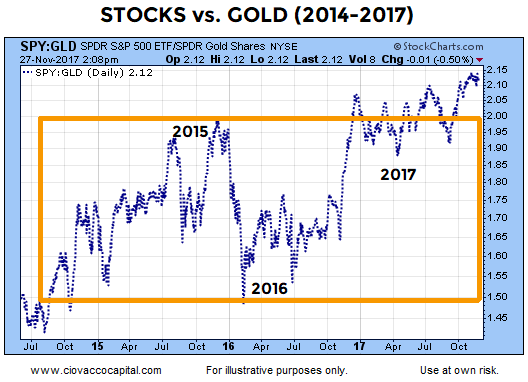
There is nothing in the stock/gold chart below that contradicts the bullish narrative told by the Value Line Geometric Index. The stock/gold ratio remains above an area that acted as resistance in 2015.


Leave A Comment