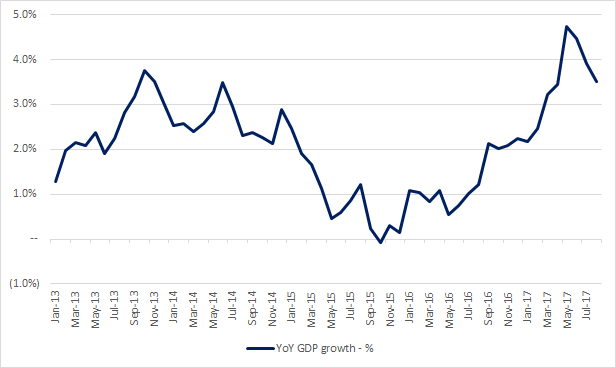
Given its natural resource-based economy, Canada is a boom and bust kind of place. This year, the country has enjoyed a significant boom. Thanks to a government stimulus program, rising corporate capital expenditures and consumer spending, Canada’s GDP growth has been nothing short of spectacular in 2017. According to Statistics Canada, the latest reading for year-over-year GDP growth is a healthy 3.5% (as of August 2017). While this is stronger than all major developed countries, growth is decelerating from its most recent peak in May 2017 (when GDP growth was an astounding 4.7%). A visual overview of historical GDP growth is shown below for reference:
Turning a corner: Canadian growth comes back down to earth

Following the crude oil bust in the second quarter of 2014, Canadian growth rates cratered. While the country avoided a technical recession, the economic outlook was poor until early 2016. After crude oil returned to a bull market in the first quarter of 2016, the fortunes of the country turned. Given limited growth in 2015, the economy had no problem delivering 2%+ year-over-year growth rates in 2016. As a substantial stimulus program ramped up government spending in 2017, growth rates have continued to accelerate this year.
Storm clouds on the horizon: crude oil and real estate
While Canada has delivered exceptional growth in the last two years, the future outlook is much more challenging. Beyond the issue of base effects (mathematically, year-over-year GDP growth will be much tougher next year), key sectors, including the oil & gas industry and Canadian real estate, look ripe for a downturn.
Crude bull market intact today, but at risk in 2018
As WTI crude strengthens beyond $55, crude oil is clearly in a bull market today. Looking at figures from the International Energy Agency, global demand growth continues to run ahead of supply growth. Thus the ongoing bull market is supported by fundamentals. Thanks to the impact of hurricanes and infrastructure bottlenecks in 2017, US shale hasn’t entirely fulfilled its role as the global ‘swing producer’ this year. The dynamics of supply growth versus demand growth are shown below:


Leave A Comment