Economists, including Ben Bernanke, give all kinds of reasons for the Great Depression of the 1930s. But what if the real reason for the Great Depression was an energy crisis?
When I put together a chart of per capita energy consumption since 1820 for a post back in 2012, there was a strange “flat spot” in the period between 1920 and 1940. When we look at the underlying data, we see that coal production was starting to decline in some of the major coal producing parts of the world at that time. From the point of view of people living at the time, the situation might have looked very much like peak energy consumption, at least on a per capita basis.

Figure 1. World Energy Consumption by Source, based on Vaclav Smil estimates from Energy Transitions: History, Requirements and Prospects (Appendix) together with BP Statistical Data for 1965 and subsequent, divided by population estimates by Angus Maddison.
Even back in the 1820 to 1900 period, world per capita energy had gradually risen as an increasing amount of coal was used. We know that going back a very long time, the use of water and wind had never amounted to very much (Figure 2) compared to burned biomass and coal, in terms of energy produced. Humans and draft animals were also relatively low in energy production. Because of its great heat-producing ability, coal quickly became the dominant fuel.
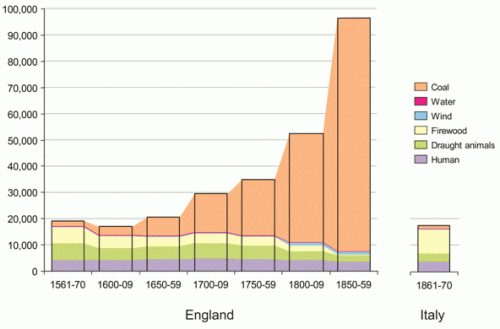
Figure 2. Annual energy consumption per head (megajoules) in England and Wales during the period 1561-70 to 1850-9 and in Italy from 1861-70. Figure by Wrigley
In general, we know that energy products, including coal, are necessary to enable processes that contribute to economic growth. Heat is needed for almost all industrial processes. Transportation needs energy products of one kind or another. Building roads and homes requires energy products. It is not surprising that the Industrial Revolution began in Britain, with its use of coal.
We also know that there is a long-term correlation between world GDP growth and energy consumption.
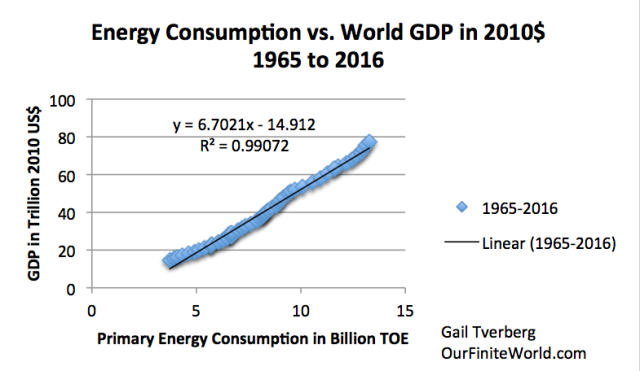
Figure 3. X-Y graph of world energy consumption (from BP Statistical Review of World Energy, 2017) versus world GDP in 2010 US$, from World Bank.
The “flat period” in 1920-1940 in Figure 1 was likely problematic. The economy is a self-organized networked system; what was wrong could be expected to appear in many parts of the economy. Economic growth was likely far too low. The chance for conflict among nations was much higher because of stresses in the system–there was not really enough coal to go around. These stresses could extend to the period immediately before 1920 and after 1940, as well.
A Peak in Coal Production Hit UK, United States, and Germany at Close to the Same Time
This is a coal supply chart for UK. Its peak coal production (which was an all-time peak) was in 1913. The UK was the largest coal producer in Europe at the time.
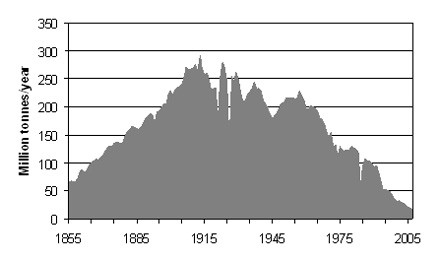
Figure 3. United Kingdom coal production since 1855, in a figure by David Strahan. First published in New Scientist, 17 January 2008.
The United States hit a peak in its production only five years later, in 1918. This peak was only a “local” peak. There were also later peaks, in 1947 and 2008, after coal production was developed in new areas of the country.
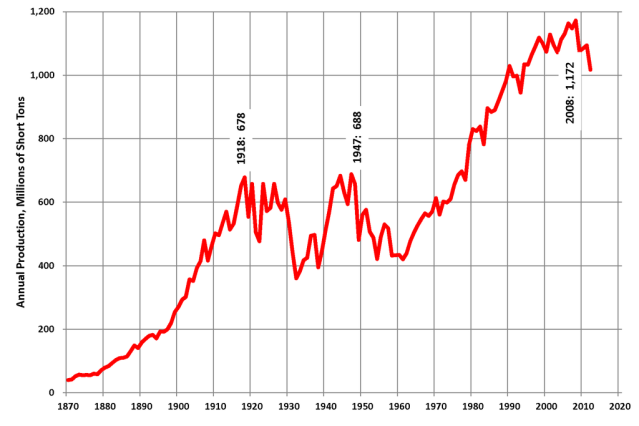
Figure 4. US coal production, in Wikipedia exhibit by contributor Plazak.
By type, US coal production is as shown on Figure 5.
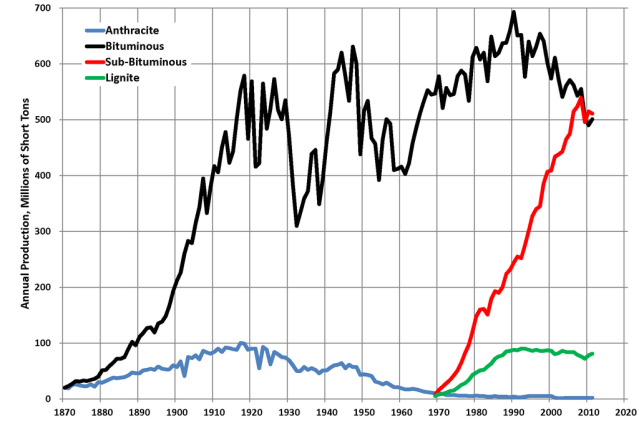
Figure 5. US coal production by type, in Wikipedia exhibit by contributor Plazak.
Evidently, the highest quality coal, Anthracite, reached a peak and began to decline about 1918. Bituminous coal hit a peak about the same time, and dropped way back in production during the 1930s. The poorer quality coals were added later, as the better-quality coals became less abundant.
The pattern for Germany’s hard coal shows a pattern somewhat in between the UK and the US pattern.

Figure 6. Source GBR.
Germany too had a peak during World War I, then dropped back for several years. It then had three later peaks, the highest one during World War II.
What Affects Coal Production?
If there is a shortage of coal, fixing it is not as simple as “inadequate coal supply leads to a higher price,” quickly followed by “higher price leads to more production.” Clearly, the amount of coal resource in the ground affects the amount of coal extraction, but other things do as well.
[1] The amount of built infrastructure for taking the coal out and delivering the coal. Usually, a country only adds a little coal extraction capacity at a time and leaves the rest in the ground. (This is how the US and Germany could have temporary coal peaks, which were later surpassed by higher peaks.) To add more extraction capacity, it is necessary to add (a) investment needed for getting the coal out of the ground as well as (b) infrastructure for delivering coal to potential users. This includes things like trains and tracks, and export terminals for coal transported by boats.
[2] Prices available in the marketplace for coal. These fluctuate widely. We will discuss this more in a later section. Clearly, the higher the price, the greater the quantity of coal that can be extracted and delivered to users.
[3] The cost of extraction, both in existing locations and in new locations. These costs can perhaps be reduced if it is possible to add new technology. At the same time, there is a tendency for costs within a given mine to increase over time, as it becomes necessary to access deeper, thinner seams. Also, mines tend to be built in the most convenient locations first, with the best access to transportation. New mines very often will be higher cost, when these factors are considered.
[4] The cost and availability of capital (shares of stock and sale of debt) needed for building new infrastructure, and for building new devices made possible by new technology. These are affected by interest rates and tax levels.


Leave A Comment