On January 1, I did what everyone else was doing and made my 2018 stock market prediction.
And here’s what my prediction was…
2018 will likely see the market panics that play into a larger drawdown […] and a rise in volatility.
Well, just one month later, my prediction has already rung true.
Volatility surged to a level not seen in over two years.

The pullback is already larger than what we saw in all of 2017.
Investors were panicking.
So, with one prediction already fulfilled, I write you again with a new prediction for 2018.
The 18.5-Year Market Cycle
The market has surged over the last 13 months, and the bull market isn’t over just yet.
But as I predicted at the start of the year, 2018 isn’t going to be a smooth ride.
I was able to make the prediction by turning to a handy 100-year-old calendar. Clearly, it is doing much better than just throwing darts at the market.
It’s the main tool I trust to give me a complete look at the overall market from a big-picture view — to know where we are at in the bull market.
The calendar is based on an 18.5-year market cycle. By using that, it is able to predict the whims of the market with accuracy that is better than anything else I have used.
Here’s how it works.

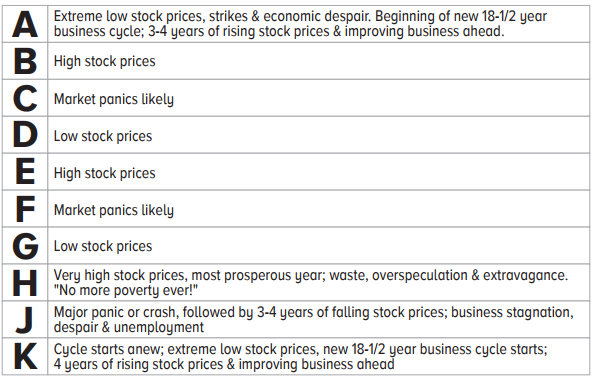
This is the 18.5-year market cycle in a nutshell.
Over every 18.5-year time frame, the years are labeled from A through K, with some years being blank.
To give you context with our recent years, 2016 was an E year which means high stock prices. 2017 was marked with an F, meaning market panics were likely. 2018 has a G that was calling for low prices. And 2020 has an H which means very high stock prices.
However, the cycle has some wiggle room. That’s why we are seeing market panics now instead of in 2017.
So that’s the cycle we are going through. It’s how I was able to predict at the start of this year that the one thing you can expect from 2018 was market panics — and this isn’t the last one.


Leave A Comment