On October 15, 2014, I wrote a piece called “When Something Itches, The Tendency is to Scratch It.”

4 years later, instead of a young and gorgeous Marilyn Monroe standing above the subway waiting for the breeze to lift her skirt, we have a plastic, painted cast of a voluptous woman who is starting to crack.
Thus far, she is holding up.
However, should she tilt forward any further, she runs the risk of becoming tangled in the precariously placed electrical wires.
I see similarities in the market, even with NASDAQ making new highs.
Rather trying to predict where equities will go, I will go bold and predict where gold, the dollar and certain agricultural commodities will go.
With the dollar’s help-higher-much, much higher.

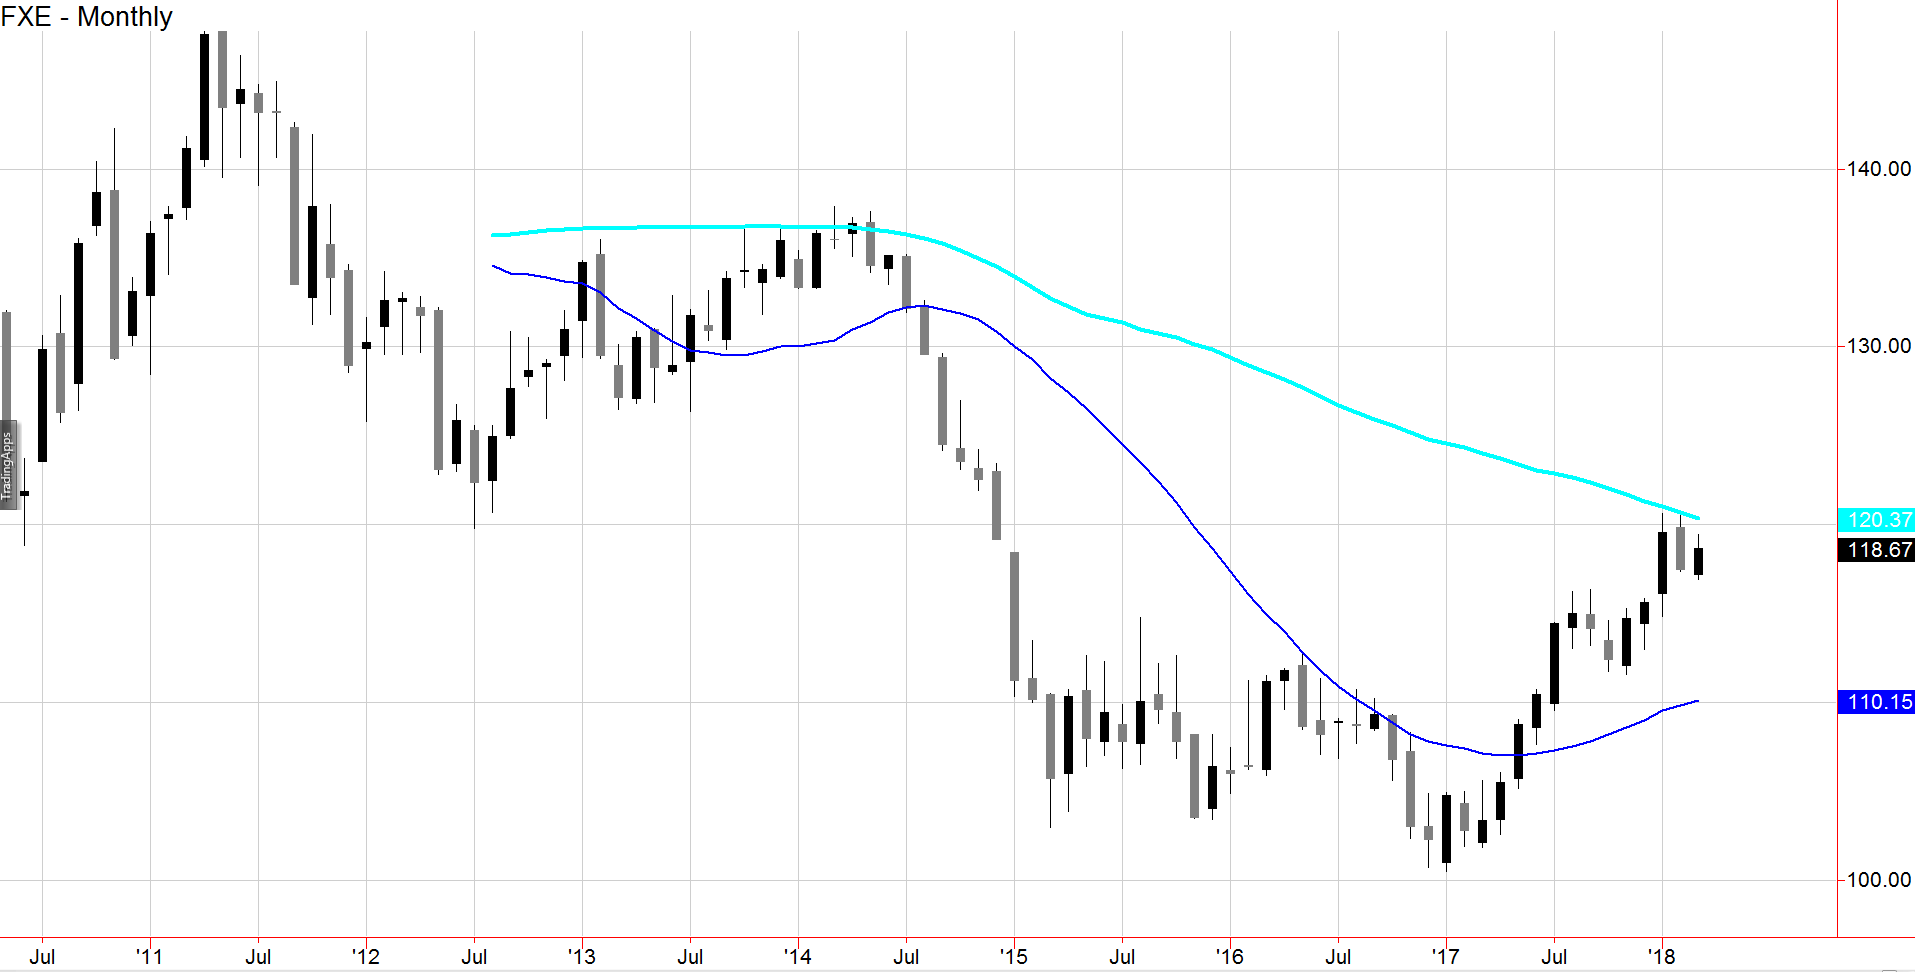
Starting with the Dollar, here is a monthly chart of the Currency Shares Euro Trust ETF, FXE.
FXE trades inversely to the U.S. Dollar.
Monthly charts are an accurate measure of seeing long-term trends that are about to reverse, retrace or continue.
In the case of FXE, the cyan line is the 80-month Moving Average.
Last summer, FXE cleared the 23-month MA or royal blue line.
Looking as if a bull flag is forming over the price action the last 3 months, should that flag confirm, we are looking at a move about $6.00 higher from here.
That will clear the 80-month MA and reverse a downtrend that dates back to 2012.
Noteworthy, emerging markets are outperforming the US market.
A declining dollar should translate to higher commodity prices. That in turn, could translate to higher inflation, which means pressure on the Federal Reserve.
I’ve been on this topic A LOT lately.
Here is a fresh way for us to determine just how much hot air our siren can take up her dress, before she topples.
S&P 500 (SPY) 275 important to hold and this needs another 3% run to match the all-time highs.
Russell 2000 (IWM) 160.63 the all-time highs. But whats even more important, is if it holds 156. As long as that level holds, this could consolidate and then blast off.


Leave A Comment