The last two months have been difficult for precious metal investors, and many have turned bearish. Prices have swung wildly in both directions whipsawing even experienced traders into submission. The charts have been difficult to decipher since October, to put it mildly. Nevertheless, a pattern has emerged supporting a potential low for gold prices next week.
The extended decline in gold has presented a similar setup to what we encountered in December of last year (see gold chart). The drop from early November is comparable in time and depth to the decline into the $1,045 low. If the correlation continues, gold prices could fall to around $1,150 next week and make a significant bottom around the time of the FED announcement.
The COT also supports a possible low. Commercials have reduced their short exposure by 33% (from 360K to 241K) since November 14th and approximately 50% from the July 8th high of 464k contracts. Not the lowest levels we’ve ever seen but a step in the right direction.
The market is estimating a 95% chance of a rate increase next week. Participants are anxious to hear the FED’s projection for continued rate hikes in 2017, and that will drive markets. A larger than expected increase or no rate at all hike would be unsettling to markets.
US Dollar
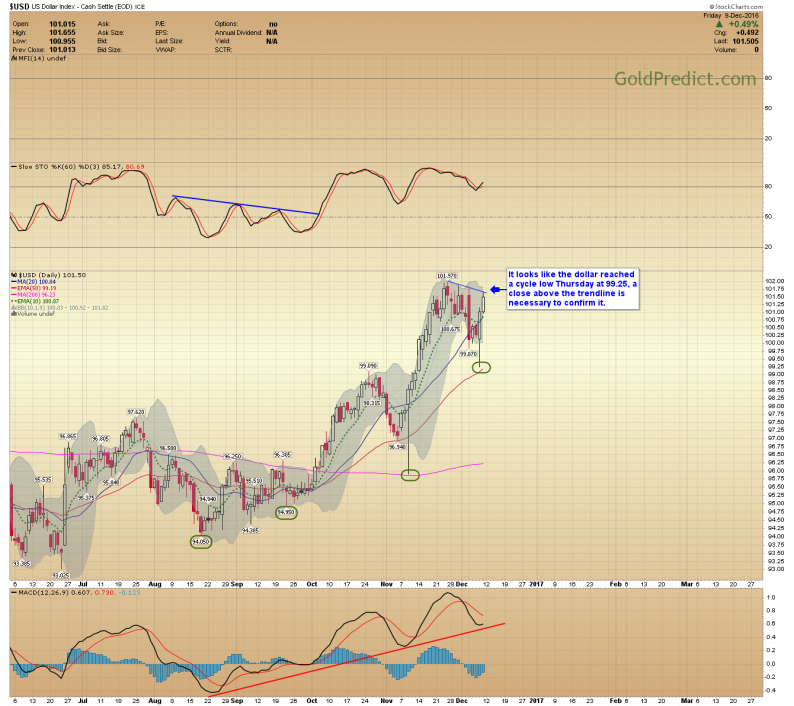
It looks like the dollar reached a cycle low Thursday at 99.25; a close above the trend line is necessary for confirmation. The potential of a strong dollar and continued weakness in the EURO could make it difficult for gold prices. Their relationship is something we will continue to monitor.

Gold
The drop into the December 2015 low is eerily similar to what we are currently experiencing. A close above the 10-day EMA and upper trend channel next week could signal a major low.
The final decline of last year extended for several weeks reaching 24-consecutive closes beneath the 10-day EMA. We are currently sitting at 24-consecutive closes below the 10-day EMA. Prices could bottom next week around the time of the FED decision.


Leave A Comment