The United States national debt is currently about $20 trillion, and the federal government is paying some of the lowest interest rates in history on that debt. The Federal Reserve has raised interest rates five times now and is publicly considering another seven increases between 2018 and 2020, for a total increase of 3%.
What will be the impact on the national debt and deficits if the interest payments on the debt jump upwards because of the actions of the Fed?

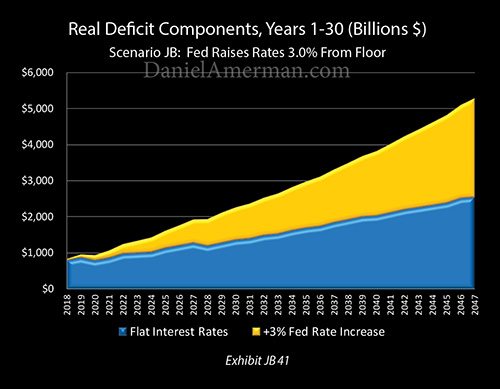
As shown in the graphic above and as will be developed in this analysis, the Federal Reserve increasing interest rates will have a building and eventually explosive impact on the annual deficits that are run by the federal government. The blue area shows what annual deficits would be if the Fed were not raising interest rates, and even in inflation-adjusted terms, those would eventually climbing to over $2 trillion a year anyway, primarily as a result of increasing Social Security and Medicare costs.
The yellow area is the increases in deficits that occur solely as a result of the increases in interest rates. As can be seen, the initial impact is small, but the damage quickly escalates. Near $2 trillion a year deficits are now reached in ten years, and then rapidly increase to over $3 trillion, then over $4 trillion, then over $5 trillion a year by 2046. In later years, this is more than twice what the deficits would be without the rate increases.
The increase in deficits sends the national debt soaring upwards – even as the interest rates paid on those larger debts are higher than they otherwise would be. This then creates a compound interest problem for the United States government. As analyzed herein, the Fed increasing interest rates by itself could increase the national debt by an additional $54 trillion in thirty years (in nominal dollars).
A nation that is $20 trillion in debt has fundamental constraints when it comes to interest rates that would not exist at lower debt levels. These constraints are likely to have a powerful influence on future yields and prices in all the major investment categories, including stocks, bonds, real estate and precious metals.
This analysis is part of a series of related analyses, an overview of the rest of the series is linked here.
Increasing Interest Rates
![]()
As shown above, effective Federal Funds rates were reduced to the lowest levels in modern financial history in the midst of the financial crisis of 2008. After remaining at record lows for seven years, with targeted rates of 0.0% to 0.25%, there have been five increases of 0.25% each between December of 2015 and December of 2017. This has brought the current target for overnight rates to between 1.25% and 1.50%.
The Fed is currently discussing raising rates three more times in 2018, by another 0.25% each. The amount and timing of such increases are never certain in advance, but it is also discussing two more increases in like amounts in 2019, and another two increases in 2020. If this or something like it happens, then there will be a total rate increase of 3% between the end of 2015 and the year 2020.
The Model
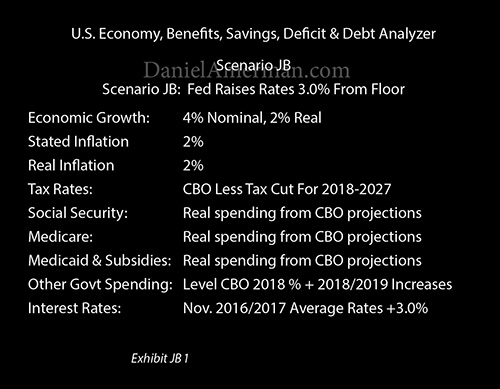
In this analysis, we will use two scenarios to examine how the Federal Reserve interest rate increases could increase future federal government deficits and the level of the national debt. For the base scenario “JA”, we will leave the average interest rate paid on the national debt at its current level of about 2.25%. For scenario “JB”, we will increase rates by 3%, up to a total average rate of 5.25%.
For this exploration, we will use a macroeconomic model which integrates the United States economy and national debt with the expected future costs of Social Security, Medicare, and Medicaid. It allows the holistic modeling of various combinations of 1) interest rates, 2) inflation, 3) benefit indexing, 4) economic growth, 5) tax rates and 6) general governmental spending, and shows the implications for the nation as a whole.
As described in the methodology notes, the core of the macroeconomic model has been “reverse engineered” from the Congressional Budget Office Long-Term Outlook (CBO LTO). It is simpler than that model, but captures the key components – and most importantly their interaction – in a way which allows for holistic scenario modeling.

As shown above, the assumptions include 2% real growth, 2% inflation, payment of Social Security and Medicare benefits in full, and a 3% increase in interest rates. The 2018 tax cut and the spending increases in 2018 and 2019 are fully incorporated, as discussed in the methodology notes.
Interest Rate Impact On Ten Year Deficits

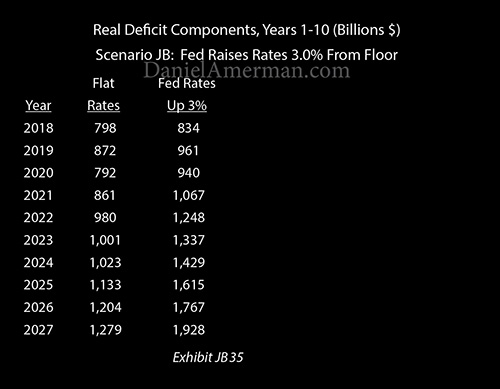
The initial impact of increasing rates is quite small, with increases in the deficit of “only” $36 billion and $89 billion in 2018 and 2019.
In understanding how the Fed increasing interest rates impacts the budget, it is critical to keep in mind that the national debt has short term, medium term, and long-term components, with a weighted average life of about 5.8 years. So rate increases by the Fed initially fully impact only short term borrowing, and then slowly increase the average interest rate paid by the government as medium term and long term bonds gradually mature and are rolled over at the new and higher interest rates. This analysis uses a simplified term structure for the federal debt, with an average life of 5.5 years, and assumes that all rates move together.
By 2021, the pace is picking up, and the annual cost to the government and taxpayers of the Fed’s increasing interest rates is up to $200 billion per year. Just two years later, that cost is up to over $300 billion per year.
By 2026 the increase in deficits that is occurring solely as a result of the increase in interest rates reaches a level of over half a trillion per year. Part of this increase is ever more of the national debt being rolled over into new and higher interest rate obligations, but there is another critically important issue.
The deficits shown are based on “Net Interest” payments, and those represent interest payments on publicly held debt only. Because interest payments on the Social Security and other Trust Funds are expenses for one part of the government (the Treasury) and income for another part of the government (such as the Social Security Administration), for the government as a whole the income offsets the expense, and the interest payments are netted out in the CBO LTO as well as within this model.


Leave A Comment