

Outlook for Bank Earnings as Fed Eases Policy
We still have a few weeks to go before JPMorgan (JPM – Free Report) and the other big banks start reporting 2024 Q3 results (JPM will be reporting before the market’s open on Friday, October 11th). Market participants have pushed down JPMorgan shares following management’s recent downbeat commentary on profitability. Specifically, JPMorgan didn’t provide guidance for 2024 Q3 or even Q4, but rather for full-year 2025 net interest income and expense expectations.Part of the issue for banks is the pressure on their net interest incomes as the Fed eases monetary policy, which got underway with the central bank’s bigger interest rate cut than many expected just a few weeks ago. That said, banking is an economically sensitive business that benefits from a declining interest rate environment through improved loan demand, favorable deposit and credit quality trends, and more investment banking activities.The current Zacks Consensus EPS estimate for JPMorgan is $16.72 on $172.03 billion in revenues, representing year-over-year changes of +3% and +8.8%, respectively. It appears that JPMorgan is trying to tame down expectations for next year, given the overall favorable tone of the revisions trend in recent months that drove the Zacks Consensus EPS estimate to rise by +3.4% over the last three months. Given the guidance, we would expect those estimates to retreat over the coming days.The JPMorgan stock’s recent pullback notwithstanding, the stock remains a stellar performer, handily outperforming its peers and the broader market. You can see this in the chart below that shows the one-year performance of JPMorgan shares relative to the S&P 500 index, Bank of America, and Wells Fargo.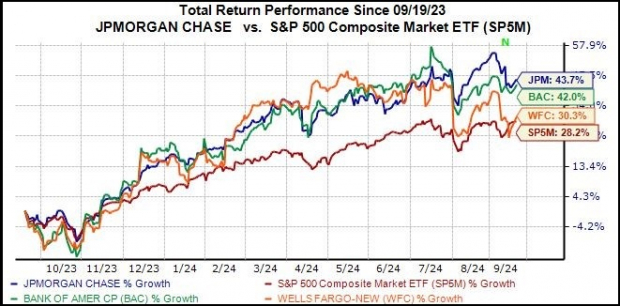
Image Source: Zacks Investment ResearchFor 2024 Q3, JPMorgan is expected to bring in $4.04 per share in earnings on $41.25 billion in revenues, representing year-over-year changes of -6.7% and +3.4%, respectively.JPMorgan isn’t alone in having a Q3 earnings decline, as Bank of America (BAC – Free Report), Wells Fargo (WFC – Free Report), and others are in the same category. The current Q3 Zacks Consensus EPS for Bank of America represents a -11% year-over-year decline, while the same for Wells Fargo is -8.6% below the year-earlier level.For the Zacks Major Banks industry, of which all of these big banks are part, total Q3 earnings are expected to be -17% below the year-earlier level on +0.7% higher revenues, as the table below shows.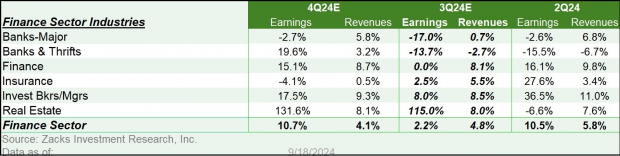
Image Source: Zacks Investment ResearchLooking at the space as a whole, the core banking business has been under pressure for some time now, with compressed net interest margins and anemic loan demand keeping net interest income flat to modestly down. Credit quality metrics have steadily weakened and are currently above pre-Covid levels but still below the long-run historical levels. While inflation has started to ease, the combination of cumulative inflation over the cycle and the softening labor market will drive the Q3 credit quality metrics.Given the moderating macroeconomic backdrop, these trends are still very much in place. But with the Fed starting to ease policy already, we can expect the bottom to be not that far off.With respect to the capital markets business, we should see continued strong year-over-year gains in investment banking and essentially flat trading activities. The capital markets business has been showing signs of steady improvement, with the trend expected to accelerate in the days ahead in response to easier Fed policy.
The Earnings Big Picture
We noted earlier how the revisions trend has been notably negative ahead of the start of the Q3 earnings season. You can see this in the chart below, which shows the evolution of Q3 earnings growth expectations since the start of the period.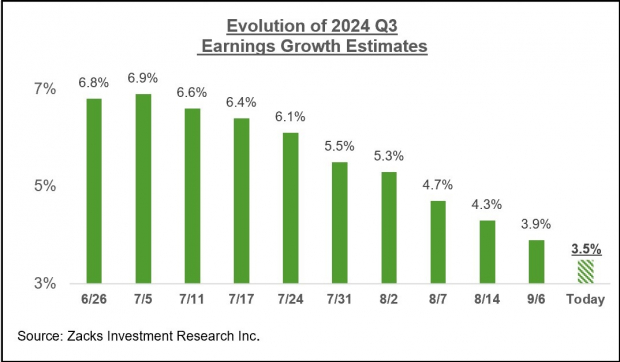
Image Source: Zacks Investment ResearchThis is a bigger decline to estimates relative to the comparable periods for the two preceding quarters. The negative revisions trend is widespread and not concentrated in one or two sectors, with estimates for 14 of the 16 Zacks sectors getting cut over this period. The Tech and Finance sectors are the only ones enjoying positive estimate revisions over this period.The negative revisions trend has been most pronounced for the Transportation and Energy sectors. We know that Energy sector estimates come under pressure when oil prices decline, with a softening oil price backdrop typically serving as a catalyst for positive estimate revision trends in the Transportation sector since fuel expenses are so costly. But the weakening revisions trend for the Transportation sector shows that operators in the space are faced with softening demand trends as well.The quarterly earnings growth pace is expected to improve from next quarter onwards. You can see this in the chart below that shows the overall earnings picture on a quarterly basis.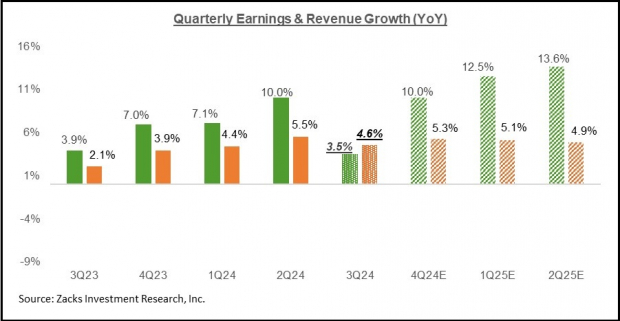
Image Source: Zacks Investment ResearchThe chart below shows the overall earnings picture on an annual basis.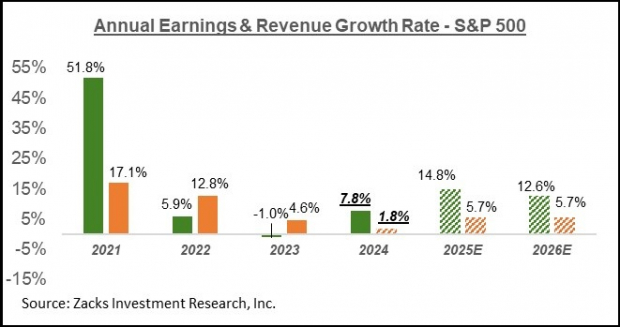
Image Source: Zacks Investment ResearchPlease note that this year’s +7.8% earnings growth on only +1.8% top-line gains reflects revenue weakness in the Finance sector. Excluding the Finance sector, the earnings growth pace changes to +7.2%, and the revenue growth rate improves to +4.2%. In other words, about half of this year’s earnings growth comes from revenue growth, with margin gains accounting for the rest.More By This Author:Q3 Earnings: What Can Investors Expect?What Will Q3 Earnings Season Show?Previewing Q3 Earnings Season


Leave A Comment