from the St Louis Fed
— this post authored by Paulina Restrepo-Echavarria and Brian Reinbold
Economists have observed that the correlation between oil price changes and equity returns changed dramatically after 2008. Before 2008 oil and equity prices were generally uncorrelated, while after 2008 they became highly correlated.

Interestingly, this change in the correlation coincides with the Federal Reserve’s monetary policy transition to the zero lower bound (ZLB), in which the Fed’s policy rate – the federal funds rate – became zero. In other words, before 2008, the fed funds rate was positive, and oil price changes were uncorrelated with equity returns. Then on Dec. 16, 2008, the fed funds rate became zero, and changes in oil prices became highly correlated with changes in the return on equity.
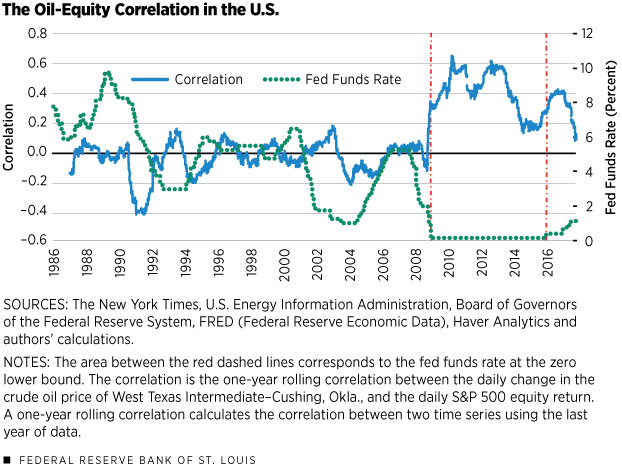
Figure 1

Figure 1 plots this rolling correlation alongside the fed funds rate.[1] The left axis shows the correlation coefficient between the change in oil prices and the change in the Standard and Poor’s 500 Index return, and the right axis corresponds to the fed funds rate.
More specifically, the correlation between changes in oil prices and changes in the return on equities was essentially zero before the ZLB. However, the correlation spiked significantly just before the zero lower bound was reached, and the increased correlation persisted during the ZLB. (See the period between the red dashed lines on Figure 1.) Indeed, the average rolling correlation was only – 0.04 before the ZLB, but averaged 0.40 during the ZLB.[2] Also, we see that as the fed funds rate increased from zero starting in late 2015, the correlation between oil and equities eventually declined, although it is still too soon to make any predictions that price changes in oil and equity will become uncorrelated again.
Given this coincidence between the ZLB and the increased correlation, it is worth asking whether being at the ZLB may be the cause for the increased correlation. Datta, Johannsen, Kwon and Vigfusson tackled exactly this question.


Leave A Comment