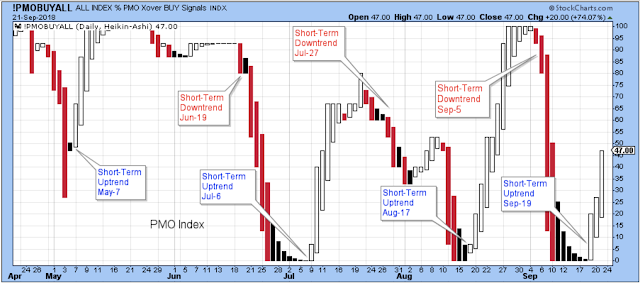
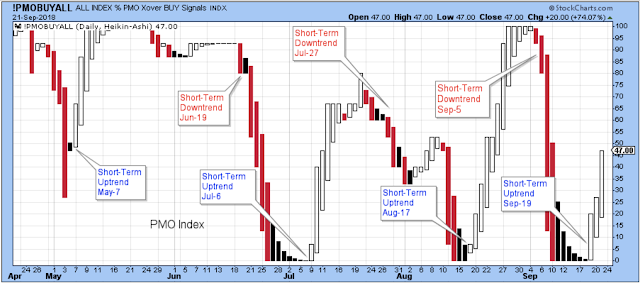
A short-term uptrend started on Wednesday. It looks like the trends may be more clearly defined than they were over the summer. I say this because the PMO has started reaching the upper and lower extremes during the cycles. When this happens, it makes it a lot easier to see the trends.
A bit of advice. It is tempting to just look at this chart of the PMO index to determine the cycles. I think that is a mistake. You need to add a few more indicators in order to confirm, such as advance/declines or momentum. Please see my previous posts for more info.
The Longer-Term Outlook
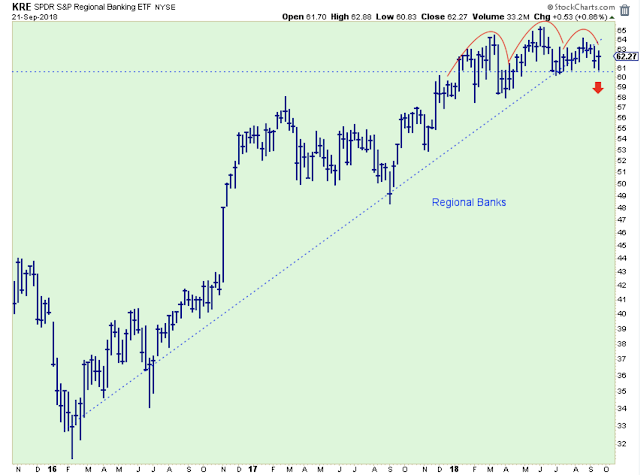
The Regional Bank index has people perplexed, myself included. There has been a trend break and a potential head and shoulders looking pattern. These shares are rate-sensitive, and rates have been rising, so why the trend line break?
As with most trend breaks, you have to wait for a break below support to confirm a change in trend. So maybe the shares just got ahead of themselves and are consolidating?
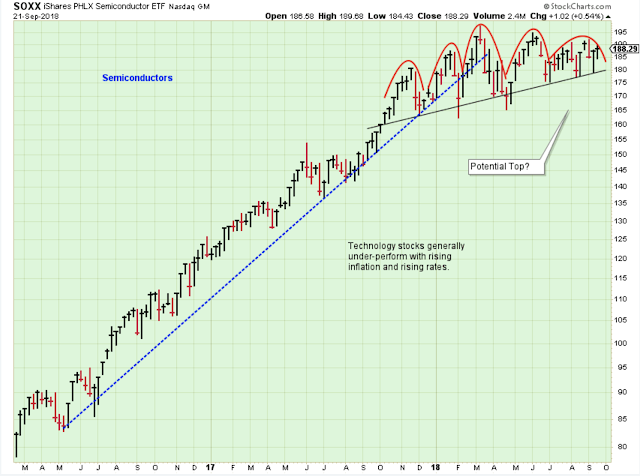
The Semiconductors showed strength this week after struggling last week. Which way will it go? Maybe we should assume it heads higher until there is strong evidence that the trend is broken.
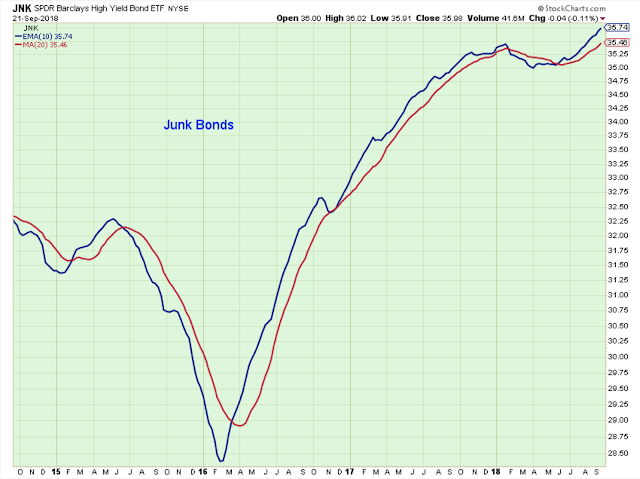
I like to invest in the direction of junk bonds. While this ETF points higher, stocks are likely to head higher too.
Advance/declines are pointing in the direction of higher stock prices.

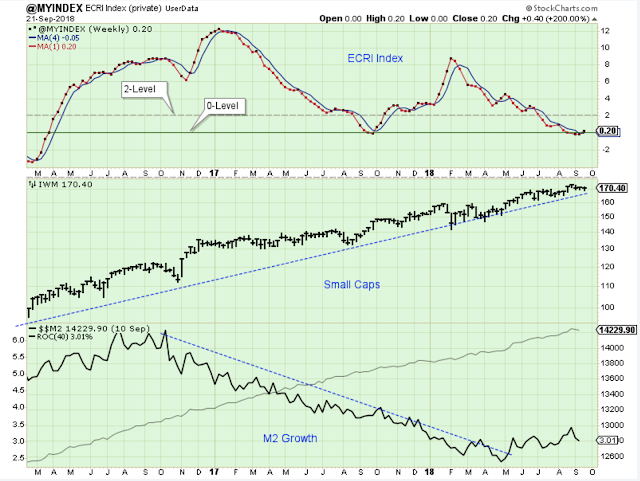
There are a few stock market negatives. The ECRI index is weak, although it may have reached its low point. The ECRI has been warning of an economic slowdown. Maybe this is why the regional banks are weak?
As you can see from the middle panel showing the small caps, just because there is an economic slowdown, it doesn’t mean that stock prices can’t keep heading higher.
Now we are moving into the charts that have been making me feel bearish towards stocks… incorrectly bearish. The number of new 52-week highs is way below trend meaning that far fewer stocks are pushing the indexes to new highs. The market has completely defied this indicator.



Leave A Comment