
Every once in a while I like to trot out the monthlies so we can refresh the big picture view. So, here they are on a few varied items.
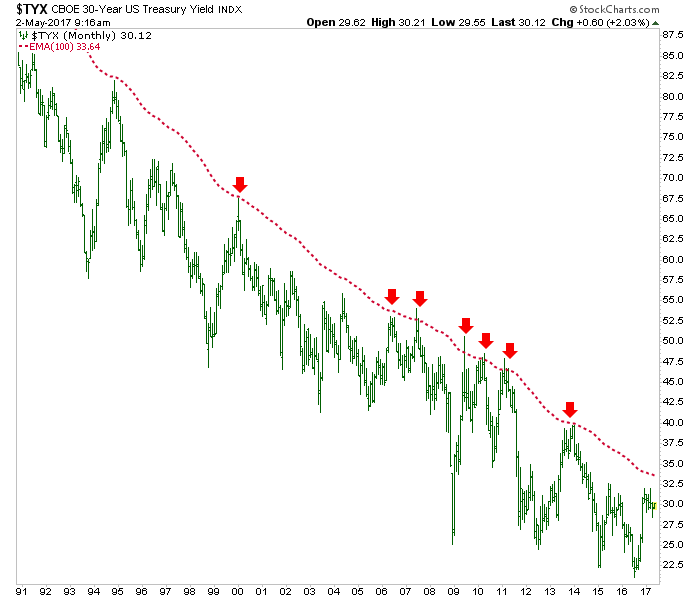
The 30 year yield (TYX) has dropped a bit as expected (ref. the contrary play in bonds we’ve followed for months now) but has not risen to the limiter, AKA the EMA 100. I am open to that this year.
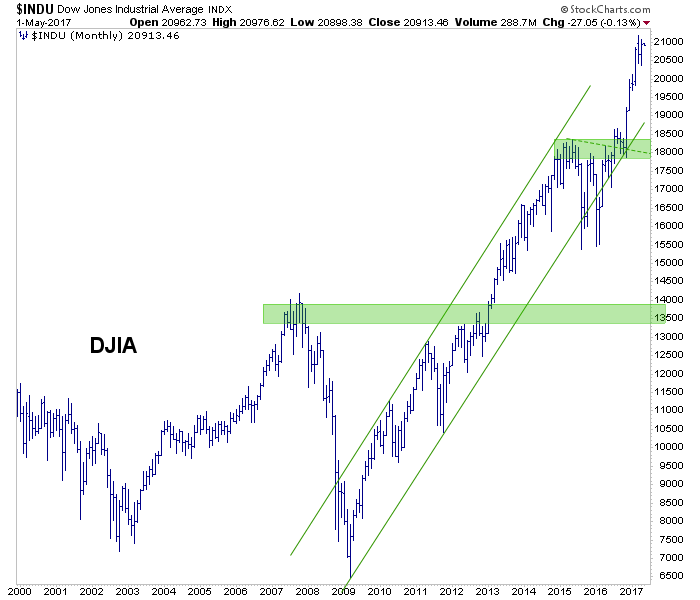
The Dow is around the target of 21,000 and has little support until the 18,000s.
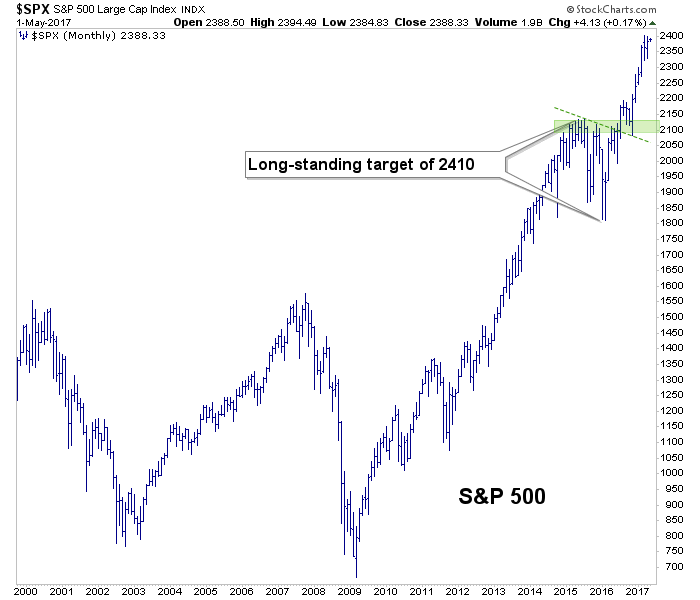
SPX is similar, with its 1st notable support just above 2100.
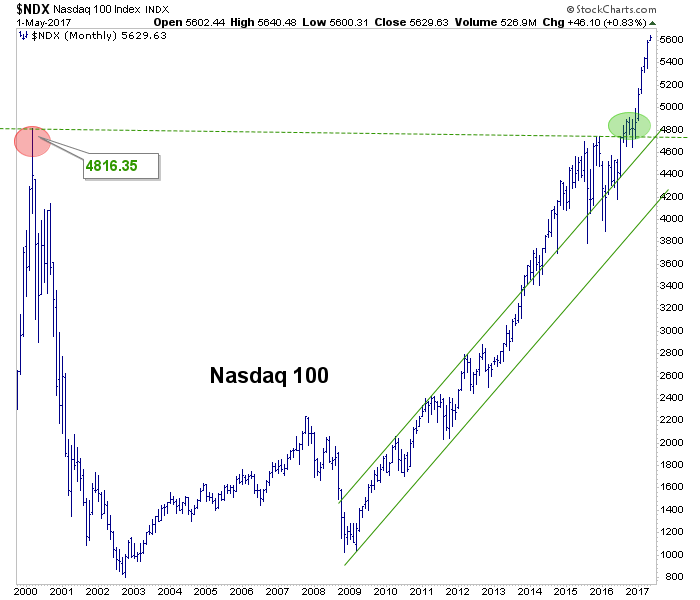
NDX hearkens back to those heady days in 1999. It’s a bubble of some kind folks. ? oh look, he said bubble! Easy now, we are not talking about timing. We are talking about condition. 1st real support would be 4700 +/-.
SOX sees my former target and mocks me.
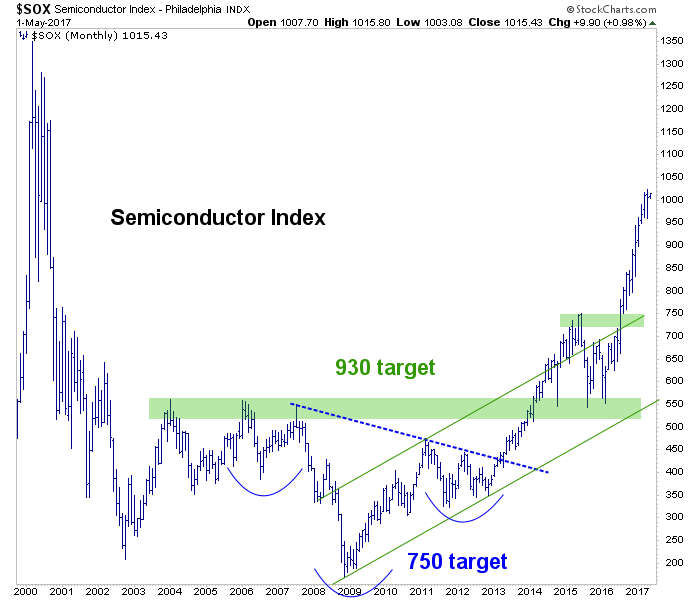
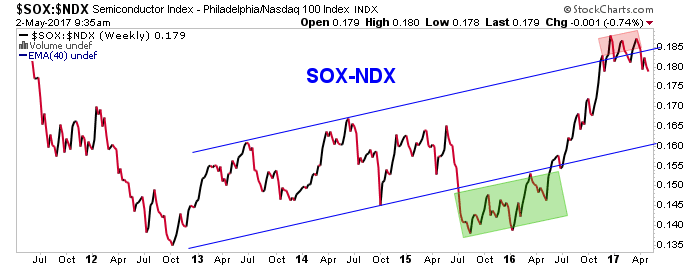
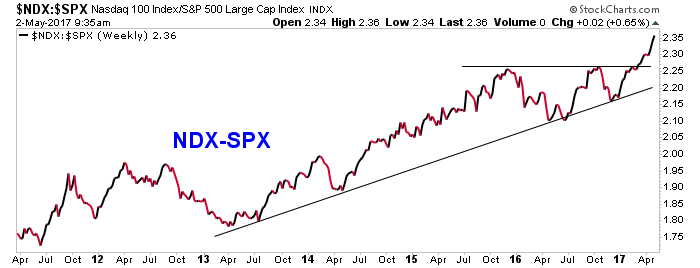
We call the SOX “the leader’s leader” due to these two charts reviewed weekly in NFTRH. They are weekly indicator charts, currently showing SOX/NDX fading while NDX/SPX continues to bull.
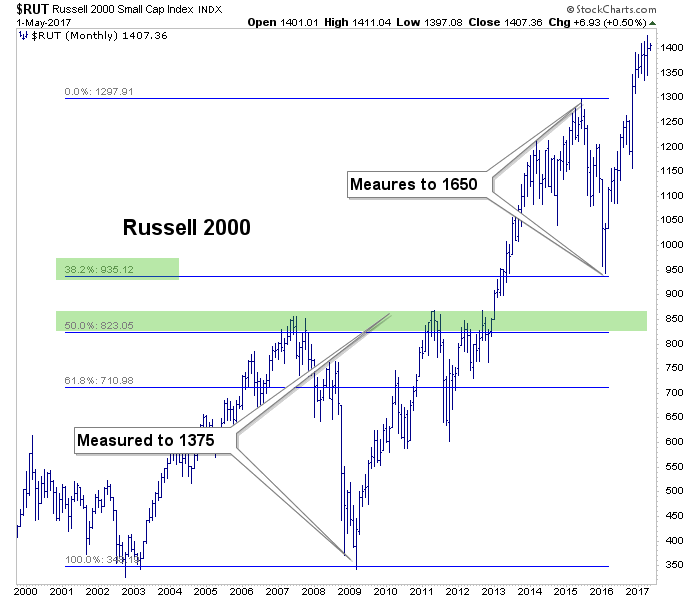
RUT has a lunatic target assigned to it. This should not be taken seriously, just as the previous target of 1375 should not have been taken seriously when it was established back in 2012 or 2013.
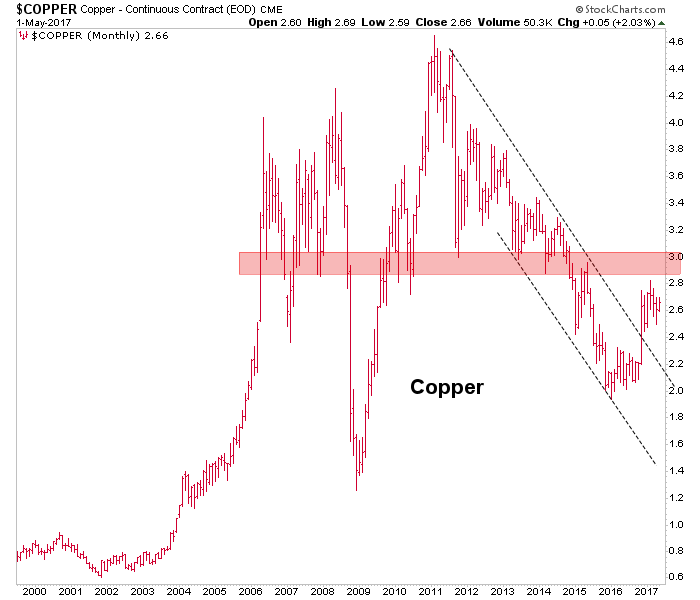
On to a couple commodities, the market’s “copper roof” continues to be in play. This was not so relevant during the Obama years when monetary policy blew the bubbles and floated the markets. But under Trump, it would be fiscal policy that would float the various asset bubbles. This reflation would show up in commodities, one would think. So that thick long-term resistance is very key in copper and the “copper roof” theme could be in play. A failure could see much pain in asset markets, while a break through could see much inflation hysterics. Stay tuned.
Crude oil targets 75 says this chart. And I am the guy who just finished covering a short against oil based on shorter-term charting. But the pattern is still there although a little more of a drop and it could get neutralized.


Leave A Comment