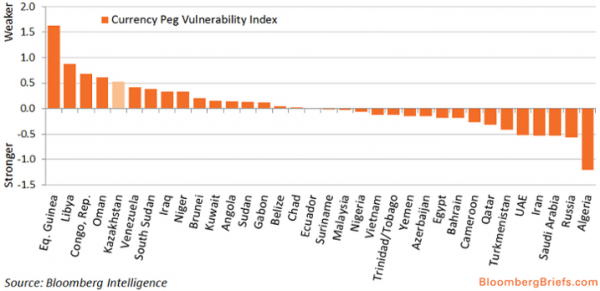
Ever since Kazakhstan stormed onto the radar screens of a whole host of mainstream financial market commentators who might not have previously known that there was a place called Kazakhstan, everyone wants to know which currency peg will fall next.
Over the past week, we’ve taken a look at the riyal, the dirham, and of course, the Hong Kong dollar.Below, find a new chart from Bloomberg which attempts to show which pegs are most vulnerable based on the following six statistics: 1) Oil rents as a percent of GDP; 2) the current account balance as a percent of GDP; 3) external debt as a percent of GNI; 4) total reserves in terms of months of imports; 5) total reserves as a percent of external debt; 6) the change in the real effective exchange from 2010 to 2014.


Leave A Comment