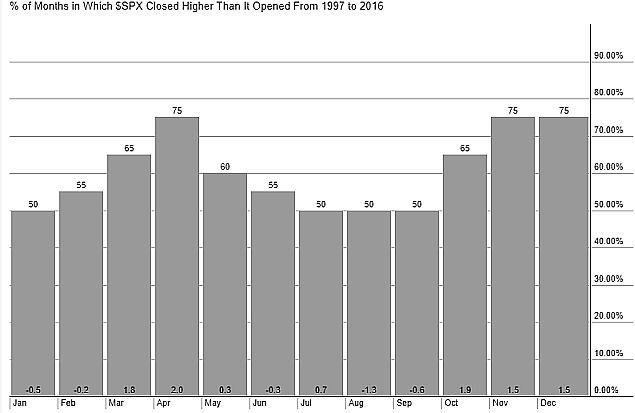
September is a mediocre month for stocks overall, but these stocks have still managed to climb at least 70% of the time and produced as much as 8% gains on average.
Seasonality is the study of how assets perform at certain times of the year. The stocks below have shown a strong tendency to rise in September, historically. That doesn’t mean they will rally this September, though. Seasonality is best used in conjunction with other forms of analysis and specific trading strategies.
Before getting into the best historical September stock performers, stocks as a whole (as gauged by S&P 500 index) tend to be a coin flip in September. Over the last 20 years, the index has moved higher 47% of the time (number on top of September column), with losses being slightly larger than profits, resulting in an average loss of -0.6% (number at bottom of September column).

StockCharts.com
Strong Seasonality Stocks for September
The statistics below are based on the historic monthly opening and closing prices. Therefore, gains or losses within the month may be larger than those disclosed below. For example, a statistic may say the biggest rally on a monthly basis was 15%, but during the month the stock could have been up 20%, but dropped to only finish the month up 15% (intra-month losses could also be bigger). This is why it is also recommended traders combine these statistics with other strategies, which help control risk and lock in profits.
Buying at the open and close of the month is also somewhat arbitrary. There are more precise times to take trades. Focus on seasonal opportunities that align with strategies you are already using.
This is the raw data. How you interpret it, and what you opt to do with it, is up to you.
All stocks do at least 100K in average daily volume.All stocks with an average gain of less than 3% have been excluded.
78% Rally Rate
Paychex (PAYX)
Price has rallied 21 out of 27 years, or 78%.


Leave A Comment