T2108 bullish divergences still in full effect
I don’t tend to post the T2108 chart all that often, but I have lately because it does a much better job of forecasting and determining market direction following a major market sell-off.
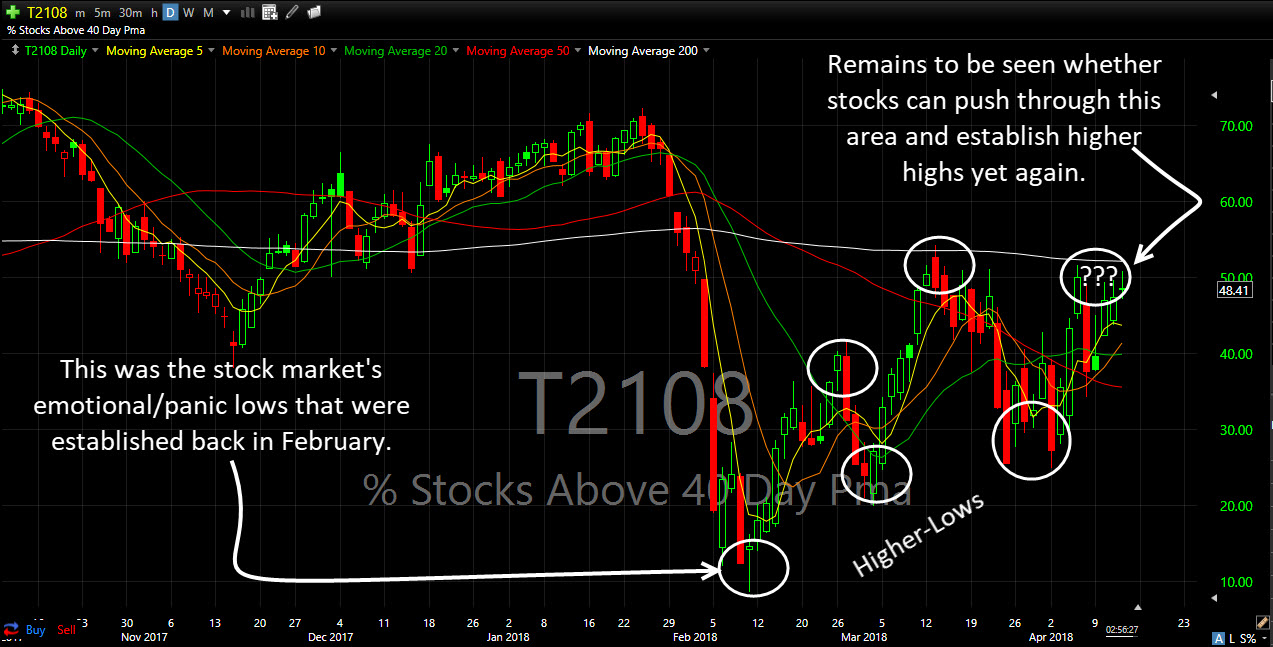
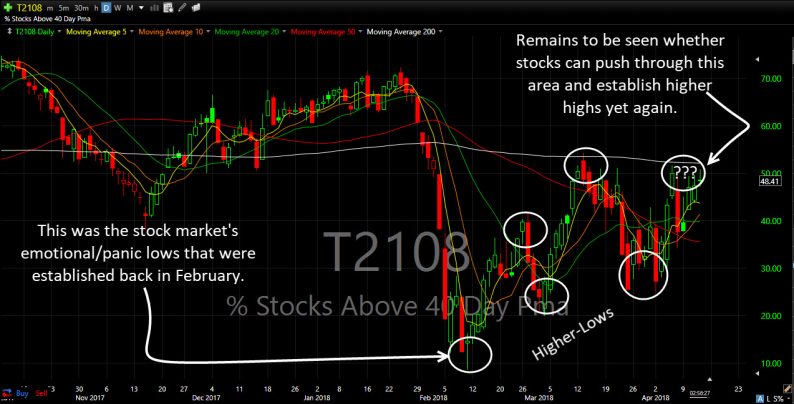
Extremes are best seen on this chart, particular when the readings delve into the single digits as it did back in February. Right now, those lows remain very significant to the market, because of the amount of sheer panic and emotion that was seen in the market that day, and the hard, subsequent reversal thereafter.
We’ve seen nothing like those days back in early February when the Dow saw intraday swings in excess of 1000 points.
…And the T2108 reflects that.
Since those intraday lows were established, the T2108 has established consistent higher-highs and higher-lows – a very promising sign for the bulls that are hoping this market can sustain the bounce off the lows for now.
Here’s the T2108 chart:


Leave A Comment