Bad Breadth Can Foreshadow Bear Markets
Market breadth speaks to the number of stocks participating in an advance. Strong market breadth means a high percentage of stocks are making new highs as the major indexes make new highs. Strong breadth also aligns with widespread confidence in stocks and the economy.
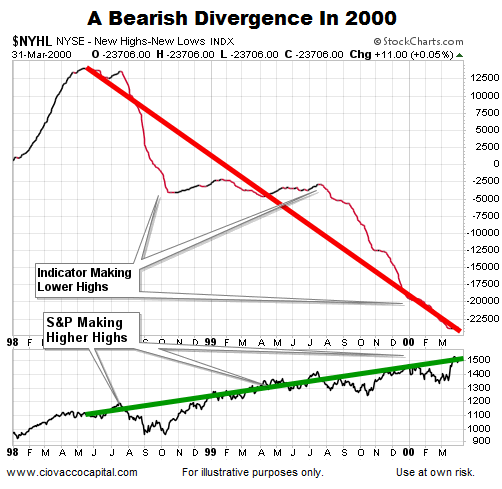
Bearish Divergence In 2000
The chart below tracks the number of NYSE stocks making new highs minus the number making new lows. A bearish divergence was clearly evident well before the bull market peaked in March 2000.

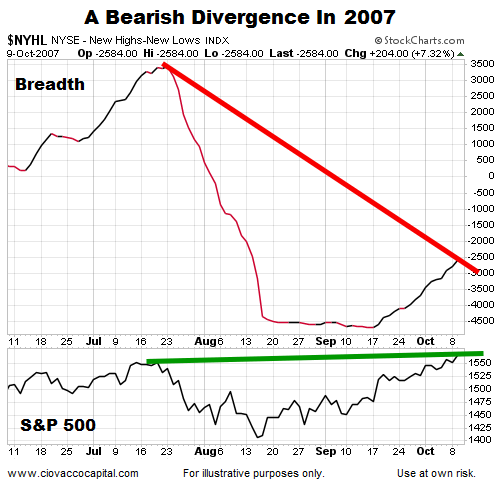
Bearish Divergence In 2007
NYSE New Highs – New Lows ($NYHL) also failed to confirm the S&P 500’s new high in October 2007, telling us many stocks were already showing signs of weakness before the major averages peaked.

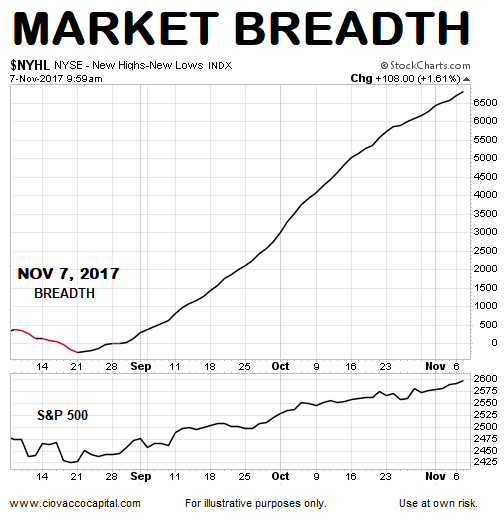
Quite A Bit Better In November 2017
How does breadth look as of November 7, 2017? Instead of a bearish divergence, $NYHL has been confirming the recent new highs in the major indexes.

Is The Bigger Picture Also Leaning Bullish?
This week’s video explores annual charts to better understand the long-term outlook for stocks.
How Does Breadth Help Us?
Like any chart or indicator, $NYHL helps us assess the probability of good things happening relative to the probability of bad things happening. The probability of bad things happening never drops to zero. Market breadth in 2017 leans toward the “good things happening” end of the spectrum.


Leave A Comment