What do I mean by “worst possible environment”? I mean an extremely overvalued, over-bullish stock market that now finds itself in a downtrend.
Let’s take a look at these individually. As for “extremely overvalued,” I prefer to look at Warren Buffett’s favorite measure of market cap-to-GNP. It shows that only during the height of the dotcom bubble were stocks more expensive than the are today. In fact, today’s valuations are roughly equivalent to November of 1999.

The reason I prefer this measure is that it’s very highly negatively correlated to future 10-year returns. The higher the valuations, the lower your forward returns. As Buffett would say, “the price you pay determines your rate of return.” Pay a lofty price and get a meager return.
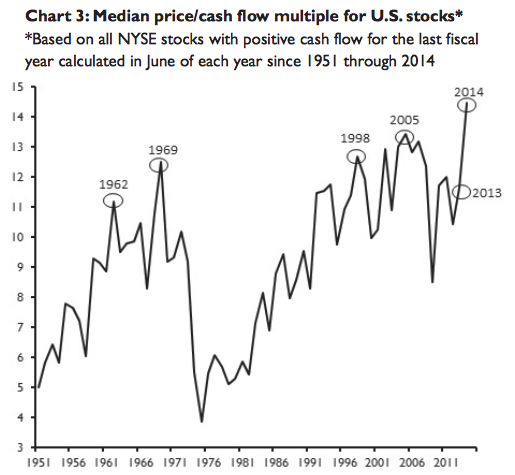
If you prefer price-to-earnings ratios, however, I would point out that the median p/e is even higher than it was during the dotcom bubble. In fact, it’s never been higher than it is today (since the chart below was created prices are about flat and earnings are down).

When I use the term “over-bullish” what I’m really referring to is the level of “greed” or “euphoria” built into the market. Yesterday, I demonstrated that leveraged financial speculation relative to overall economic activity recently reached a record high. In the past, this has not been good for stock prices. This is probably my favorite way to gauge longer-term sentiment because it is also highly negatively correlated with future returns. When speculation is high, forward returns are low or negative and vice versa.
There are a variety of other measures, though, that confirm the idea that investors in the stock market have perhaps never been more bullish than they are today. The Investors’ Intelligence Survey’s spread between bulls and bears recently hit record highs (and sustained them for quite some time).


Leave A Comment