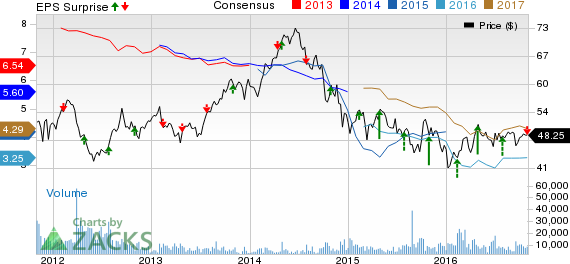
Integrated oil and gas company TOTAL S.A. (TOT – Free Report) reported third-quarter 2016 operating earnings of 84 cents per share (€0.76 per share), laggingthe Zacks Consensus Estimate of 85 cents by a penny.
Moreover, third-quarter operating earnings plunged 28% from the year-ago tally of $1.17 per share (€1.06 per share).
Total Revenue
Total revenue in the reported quarter came in at $37.41 billion, down 8% from $40.58 billion in the year-ago quarter. Reported revenues also surpassed the Zacks Consensus Estimate of $35.4 billion by 5.5%.
Production
Total hydrocarbon production during the third quarter of 2016 averaged 2,443 thousand barrels of oil equivalent (kboe) per day, up 4% year over year. The increase was primarily driven by new project startups, partially offset by the security situation in Nigeria and forest fires in Canada.
In the third quarter, liquids production averaged 1,290 thousand barrels per day, up 4%. Higher liquid production in Europe, Central Asia and America drove the overall output level, which was partially offset by lower production in the Asia-Pacific region.
Gas production during the quarter was 6,286 thousand cubic feet per day, up 5% year over year. Soft performance in Africa was more than offset by an increase in production in the Asia-Pacific, Europe, Central Asia and America.
TOTAL FINA SA Price, Consensus and EPS Surprise

TOTAL FINA SA Price, Consensus and EPS Surprise | TOTAL FINA SA Quote
Realized Price
In third-quarter 2016, the realized price for Brent was down 9% to $45.90 per barrel from $50.50 in the year-ago quarter. The average realized liquid price dropped 6% to $41.4 per barrel from the year-ago level of $44.0.
Realized gas prices tumbled 23% year over year in third-quarter 2016 to $3.45 per Mbtu.
Realized hydrocarbon prices fell 11% to $32.4 per boe from $36.6 in third-quarter 2015.
Sale & Purchase of Assets
In the third quarter of 2016, TOTAL acquired assets worth $1,018 million, primarily comprising the buyouts of Saft and Lampiris. On the other hand, the company sold assets worth $91 million during the same period.
Financial Update
Cash and cash equivalents as of Sep 30, 2016 were $24.80 billion compared with $25.86 billion as of Sep 30, 2015.
The net debt-to-equity ratio was 30.6% at the end of third-quarter 2016, up from 26.6% at the end of third-quarter 2015.
2016 Guidance


Leave A Comment