Aug 25 was the last Friday in August. Hence, it is a trade day Friday.
For backtesting purposes, trade day Fridays are assumed bought. Non trade day Fridays are reported each week although the results are not followed. Although never tested, there should be no reason why any Friday should be preferred over another.
Trade Day Friday Rankings
Rankings are based on close of markets on Friday. Backtesting results are predicated on sell the exiting position(s) on Monday opening and purchasing the highest-ranked ETFs on Monday’s open.
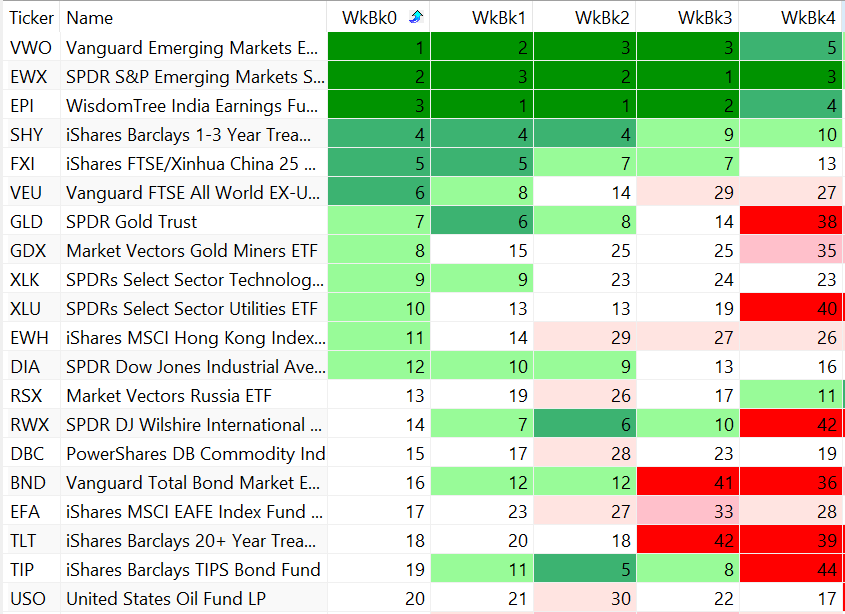
Trade Day Friday rankings appear in column WkB0 (“week back zero” which represents the current ranking). Wkb1, 2 etc. represent rankings one, two and more weeks ago.
Trade Day Friday — Aug. 25, 2017

Commentary
Using the Table
The color codes in the table help to assess the stability of markets. The first column shows that various shades of green are used to classify the top 12 ranks. Although not shown in Wkbk0, white is used for rankings from 13 – 25. Thereafter, various shades of light pink to dark red are used.
Stability
Of note is that the highest three ranked ETFs have not changed for four consecutive weeks (although there has been some shifting within these rankings. Even five weeks ago, the top three were strong.
Composition
The three top funds are International, with two of those representing emerging markets. In fact, five of the top six are international with only SHY, a short-term bond fund, being an exception. There is not a US stock-oriented ETF in the top six. Nor has there been one for the last three weeks of rankings.
Conclusions
Several weeks back the composition of the market was noted as shifting away from the US. That is reflected now in the latest rankings. I take this to mean to continue to be very cautious regarding markets in general and the US in particular. Frankly, if the US markets tank, it is unlikely all others will not be drawn under from their wake.


Leave A Comment