Gold soared by the end of the week. Miners didn’t – the HUI didn’t even move above the previous March highs. Silver’s performance was rather mixed, but closer to the one of miners than the one of gold. Why did gold rally? Why didn’t miners rally? How can the silver CoT numbers help in this case?
Let’s start with the first question. Why did gold rally in the final part of the previous week? The first reason was likely the increased tension regarding interest rates and Powell’s first Fed meeting. This was likely to cause only temporary volatility and it seems that it did. Based on how mining stocks performed relative to the gold market, it certainly seems that the precious metals market wants to go down. But, there’s another fundamental development that triggered another rally in gold (to a smaller extent) – the trade war. This term is too far-fetched – it’s just a trade battle for now. Let’s focus on the practical implications for the precious metals market. In short, just like a few threats between the U.S. and North Korea, the trade tensions between the U.S. and China are a geopolitical event.
Unless the conflict escalates further (and we doubt it), the impact on prices is likely to be only temporary, just like it is the case with geopolitical events in general. The way the price moves from here will depend on two factors: one is based on the way the investors want to react and the second is based on how the safe-haven factor comes into play based on the escalation of the trade conflict. The former is something that we can predict based on the charts and the latter is something that we cannot predict based on the charts and that depends on individual political decisions.
The long-term factors present on the charts are not easily manipulated by short-term developments like the recent news and they don’t feature any changes. The outlook remains clearly bearish.
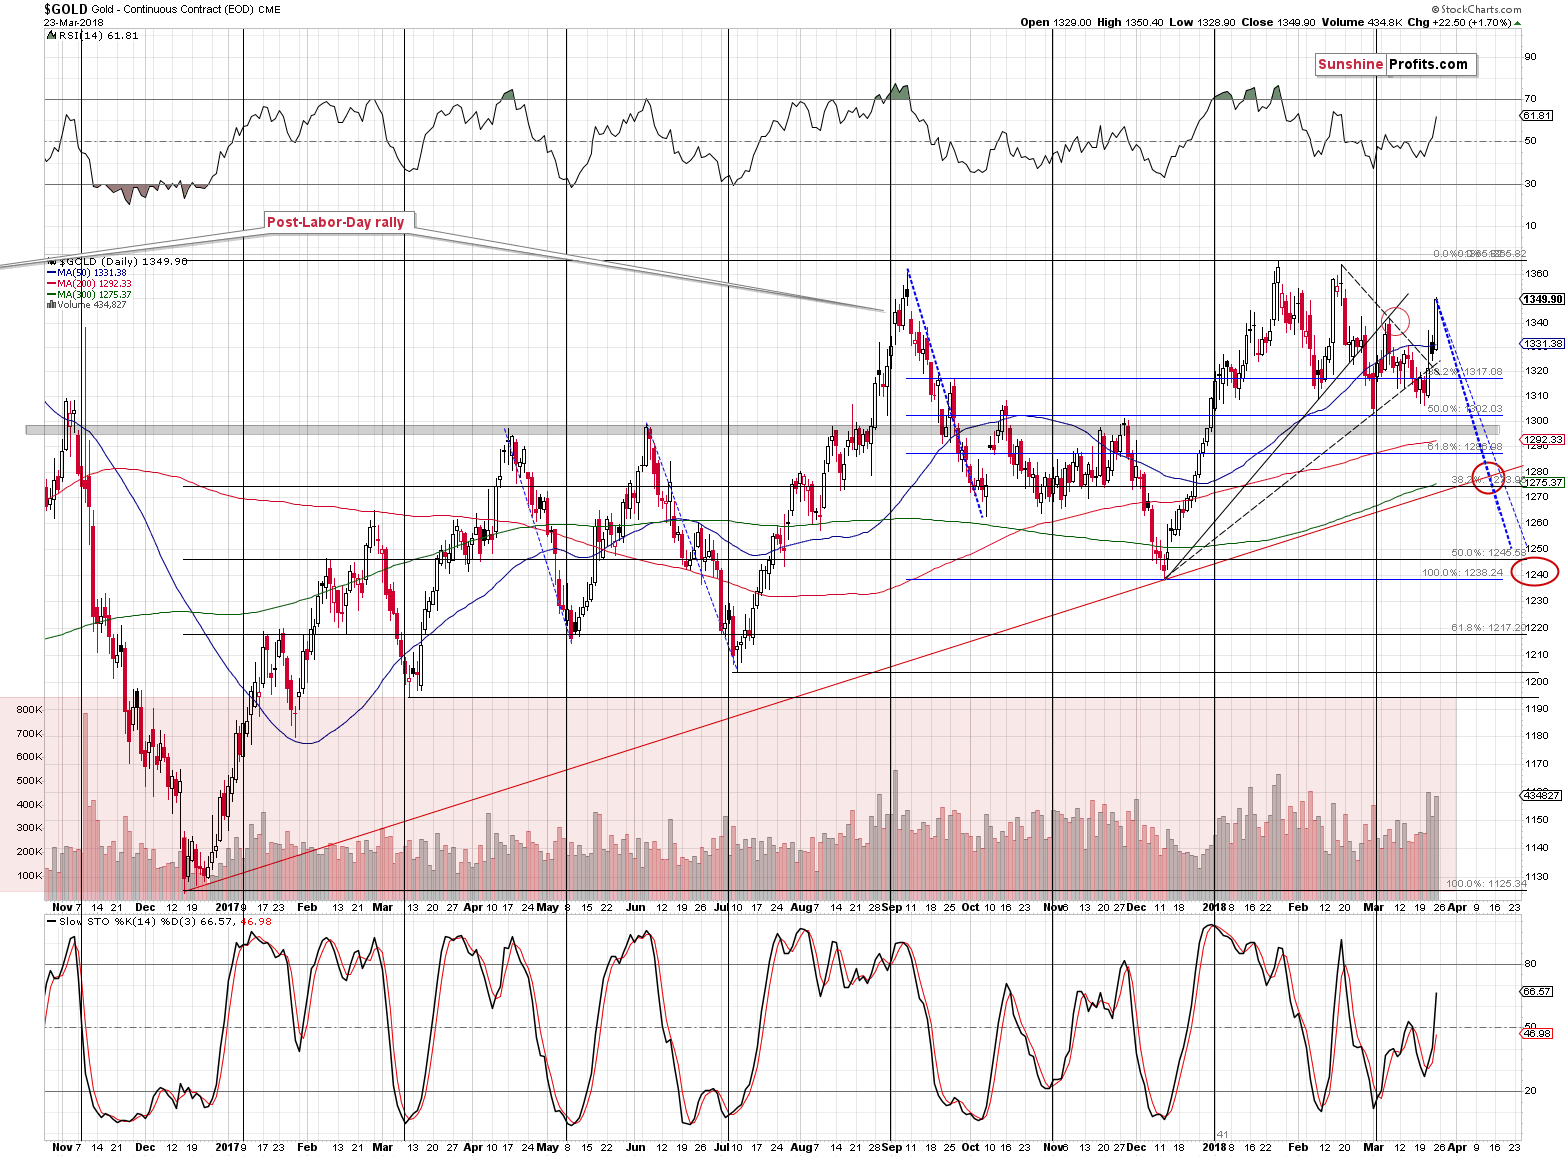
The short-term factors present on the charts can be impacted by the fundamental issues, but that doesn’t make the short-term chart analysis worthless. Most of the time, the situation develops unaltered and if it is altered – by important news, like it was the case last week – the price path changes from something that was determined by the previous price moves to what is determined by the price moves that include the news-based moves. In other words, technical analysis, cycles and so on do not become useless once something beyond them moves the market. They simply work in a different way. It’s clearly visible on the gold chart below (chart courtesy of http://stockcharts.com).
Gold’s Rally and Price Patterns

We previously had a situation in which gold was likely to decline and probably bottom before the end of the month. We also described a triple-top and an extra upswing pattern and we discussed how it was similar to what we had seen in the past.
Did any of the above become entirely invalidated based on last week’s upswing?
No. As far as the triple-top formation is concerned, it seems that the current top (the one that’s likely forming) is the third one and the early-March top was not a part of the formation at all. The analogy remains intact, although in a slightly different shape.
The rally didn’t change the apex-based turning points and it didn’t change the fact that the shapes of the declines are often similar. The only thing that changed is the starting point of the decline. Interestingly, if the price of gold declines as it used to decline in the past – in approximately the same way – then we can expect it to reach the rising red support line in the first half of April. That’s in perfect tune with the apex-based turning point. Based on the latter, we expect the next turnaround to be close to April 9th, which is more or less in tune with the shape of the decline.


Leave A Comment