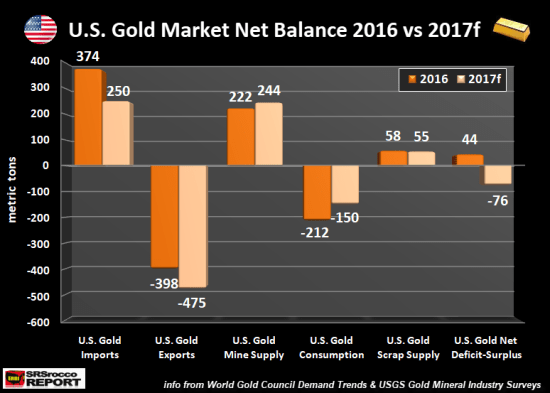
The U.S. gold market suffered a net deficit this year compared to a small surplus in 2016. This was quite interesting because U.S. physical gold demand will be down considerably this year. In 2016, total U.S. gold demand was 212 metric tons versus an estimated 150 metric tons this year. The majority of the decline in U.S. gold demand is from the physical bar and coin sector that is down 56% in the first three quarters of 2017 compared to the same period last year.
So, why will the U.S. gold market suffer a deficit if gold demand is down sharply this year? Well, it seems as if the culprit is the huge increase in net gold exports. Last year, the U.S. imported 374 metric tons (mt) of gold and exported 398 mt for a net 24 mt deficit. However, this year, estimates for U.S. gold imports will fall to 250 mt while exports increase to 475 mt. Thus, the U.S. net export deficit will be 225 mt in 2017:

However, if we look at all the data in the chart above, the U.S. gold market will experience a net 76 mt deficit in 2017 versus a 44 mt surplus last year (bars right-hand side of chart). Again, we can see that U.S. gold imports are estimated to decline significantly this year to 250 mt compared to 374 mt in 2016. Furthermore, total U.S. gold exports are forecast to increase to 475 mt this year versus 398 mt in 2016.
When we factor in U.S. gold mine supply, domestic consumption, and gold scrap supply, the market will go from a small 44 mt surplus in 2016 to a 76 net deficit this year.
So, the question remains… what happens when the markets crack, and retail investors flock into Gold ETF’s as well as surging gold bar and coin demand? This happened in the first quarter of 2016 when the Dow Jones Index only fell 2,000 points in a few months. Gold ETF inflows surged to the second highest quarterly amount ever at 350 mt. The all-time record of quarterly Gold ETF inflows took place during the first quarter of 2009 when the Dow Jones was crashing towards 6,600.During the Q1 2009, Gold ETF flows were a staggering 465 mt.


Leave A Comment