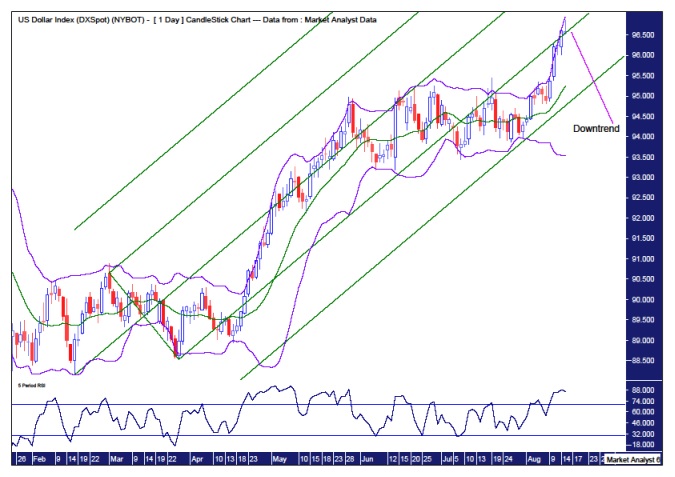
Latest Price – 96.57
Previous analysis updated – previous daily chart analysis was a bust. There remains no change to the overall outlook.
Daily Chart

Pattern – the uptrend has not been broken yet but I am looking at this recent move higher as one final whoosh to the upside to clear out the bears.
Bollinger Bands – price still hasn’t left the upper band but when it does that will be the first sign the uptrend is over.
Andrew’s Pitchfork – I have added some warning lines which provided support once price traded out of the lower channel line. This support has allowed price to have another crack at getting back inside the pitchfork formation. I expect this attempt to once again be fleeting. And I doubt the lower warning line will provide much support going forward from here.
RSI – overbought.
Weekly Chart

Pattern – the move higher the past couple of weeks sets up a 5 point broadening low formation. As the expected point 5 low is much lower, targeting around the 80 level, I often view this pattern as just a continuation pattern. In this case, the trend is down so the downtrend continues after the point 4 high.
Fibonacci – price is at resistance from the 76.4% angle and I will be surprised if price doesn’t turn down here.
Moving averages – the averages are threatening a bullish crossover and that is often the exact moment when price turns back down and I obviously think that will be the case here.
RSI – a bearish divergence has formed here.
Summing up – there remains no change to my outlook in expecting a mini crash in the second half of 2018 with price eventually bottoming out around the 80 level, as outlined in previous analysis.


Leave A Comment