The US Dollar Index has been quite volatile since the past week as the currency weighted index managed to recover its FOMC induced losses from last Thursday. The Dollar index briefly dipped to the lows of 94.35 before staging a strong recovery to trade at 96.47 at the time of writing. The index posted a healthy retracement for the past two days after rallying to 96.52 highs. Across the different time frames, the US Dollar Index has printed a bullish continuation pattern and we could expect to see a continued rally in the near term. The support formed yesterday coincided with comments from Fed Chair, Janet Yellen who reminded the markets that the US economy was ready for a rate hike with at least one rate hike due before the end of this year.

US Dollar – Technical Analysis
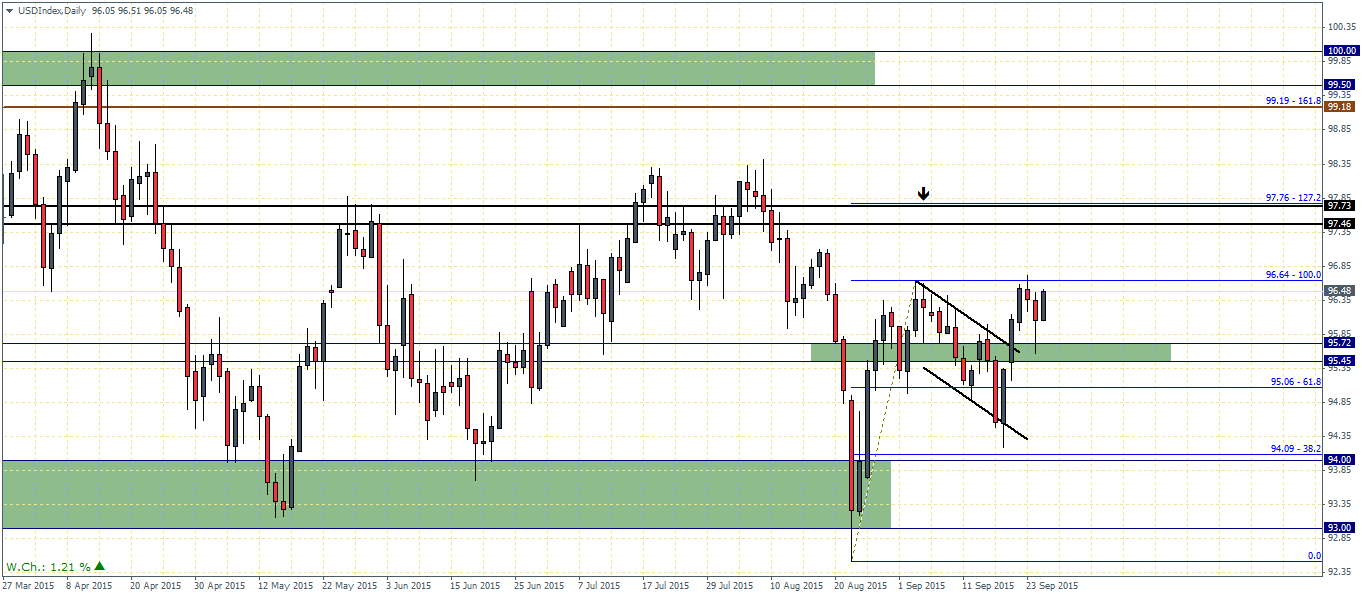
On the daily charts, the bullish flag pattern is very evident and with price clearing the main support between 95.72 – 95.45 region. Yesterday’s correction saw prices being rejected strongly at this support level indicating a bullish momentum staying intact on the daily chart. A close above the previous higher close at 96.52 could no doubt confirm the bullish continuation. Short term resistance comes in at 96.64 in the near term but as long as prices are trading above 95.72 – 95.45, the bias to the upside remains.
A break above 96.64 will see prices test the next main resistance between 97.73 – 97.46 region, followed by an eventual rally towards 99.19 – 99.5 region of resistance, the highs off April 13th this year.
Click on picture to enlarge

US Dollar Index – Daily Chart, Bull flag Pattern
On the H4 chart time frame, we notice the inverse head and shoulders pattern that was formed with prices retesting the broken neckline yesterday. The retest was near perfect with prices being rejected below the neckline. Currently, the US Dollar Index is trading near the resistance of 96.61 – 96.4 region, which shows confluence with the resistance on the daily chart.


Leave A Comment