We began using these charts earlier this year to illustrate why, despite all the negative hoopla in the media in 2016, the market very simply remained bullish, technically. Now that is being expressed for all to see and the dumb money is vigorously taking the play, with the story (all manic phases need a story, after all) of Trumponomics as its foundation (to a towering rally).
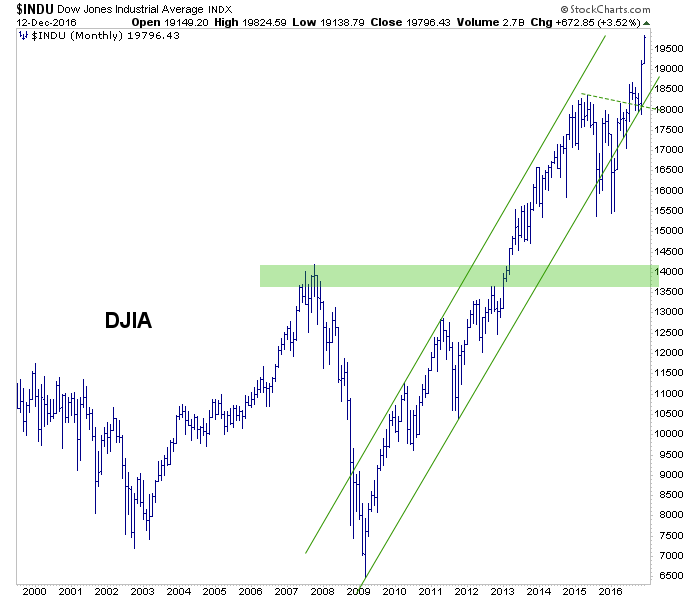
Dow held well defined support at 18000 and ass launched. The target is 21,000.
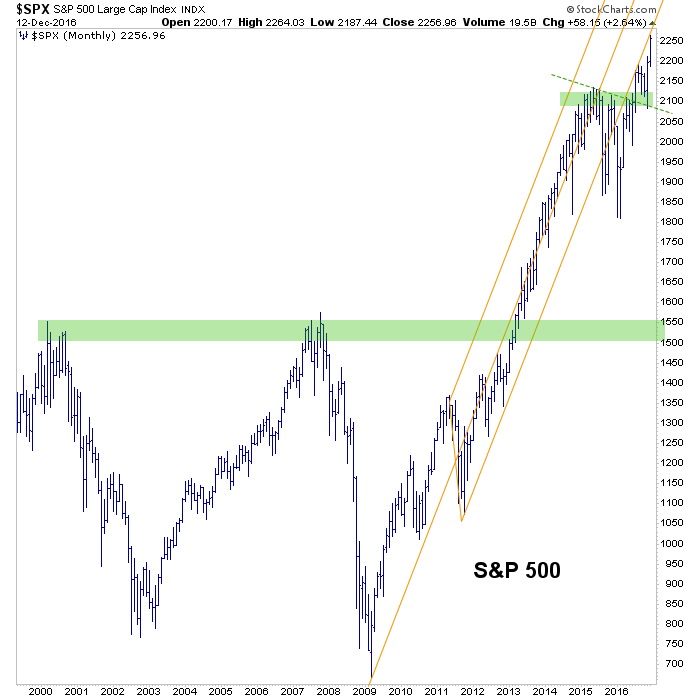
S&P 500 held its commensurate support and continues to creep up the underside of the fork (a TA novelty that is fun to draw but next to useless; don’t let ’em baffle you otherwise).
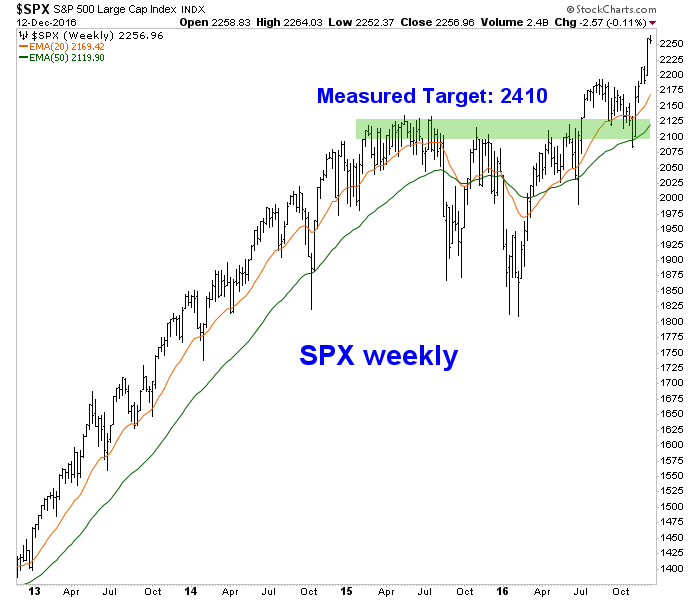
SPX weekly shows the long-standing target off of the pattern.
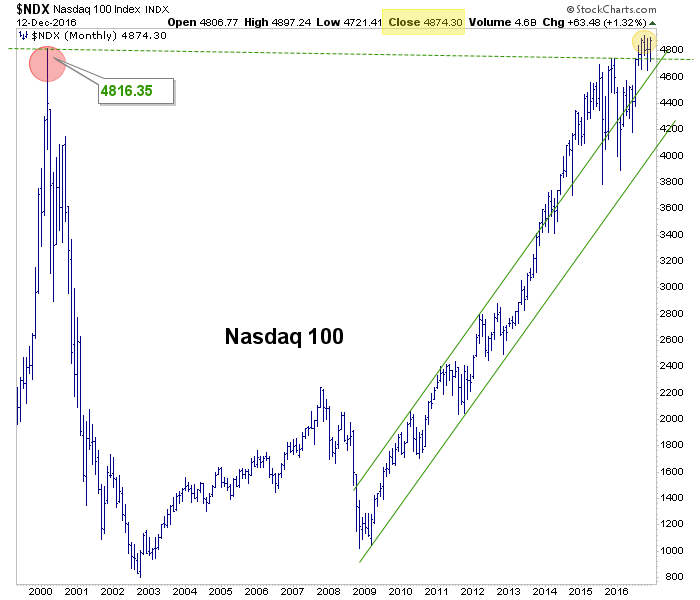
Nasdaq 100 is dwelling at new all-time highs.
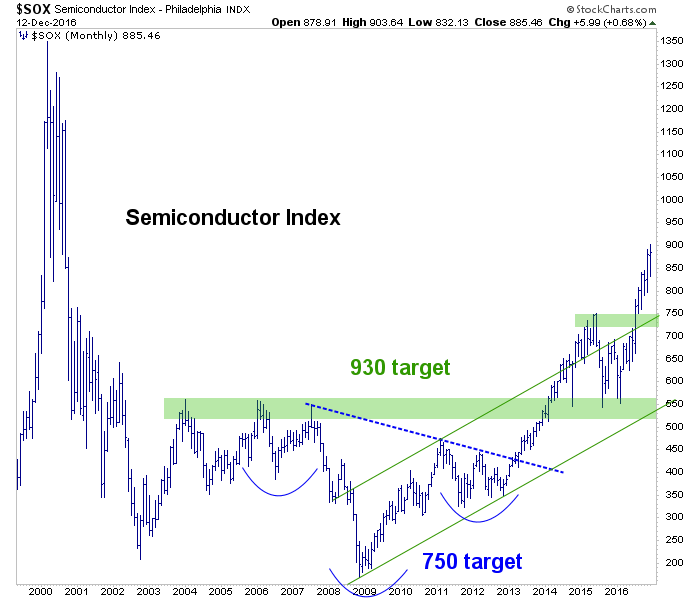
Semis appear on the way to target and I don’t know about you, but I am eagerly anticipating this month’s SEMI data from the Equipment sector, which has taken a negative turn on a 3 month trend.
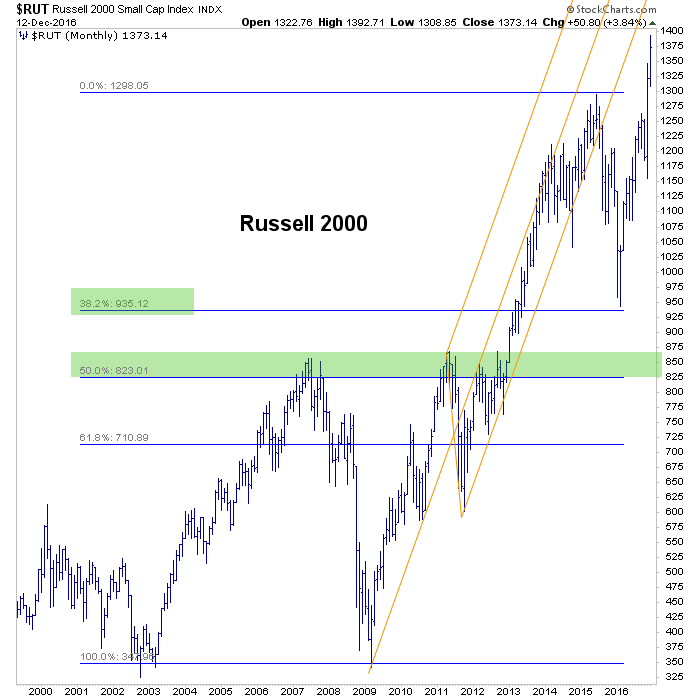
Finally, the index that I envision is benefiting from the mass influx (soon to be reflux?) of moms, pops and all the other holdouts from the dark days when the evil, redistributionist socialist regime was in power, overseeing a tripling of stocks. It’s a new day in America, which is already great again! See?
Wise assery aside, this is all sentiment stuff. I am not saying the market will not continue to be bullish at some point in 2017 or beyond, but I am saying that sentiment is driving it all right now. I’ve been bullish since the spring, so I have a right to say that. This thing of ours is about looking ahead, not backward or reporting the news in real time.
Looking ahead, the markets are homing in on targeted measurements (a target in the high 1300’s was established for the RUT years ago, by the way (if only I’d have fully believed it… ), per this chart created in either late 2012 or early 2013.




Leave A Comment