Is King Dollar in trouble against the Japanese Yen? Could US$/Yen weakness send a concerning message to stock bulls? The following charts reflect that the US$/Yen and Nikkei 225 are testing some very important levels!
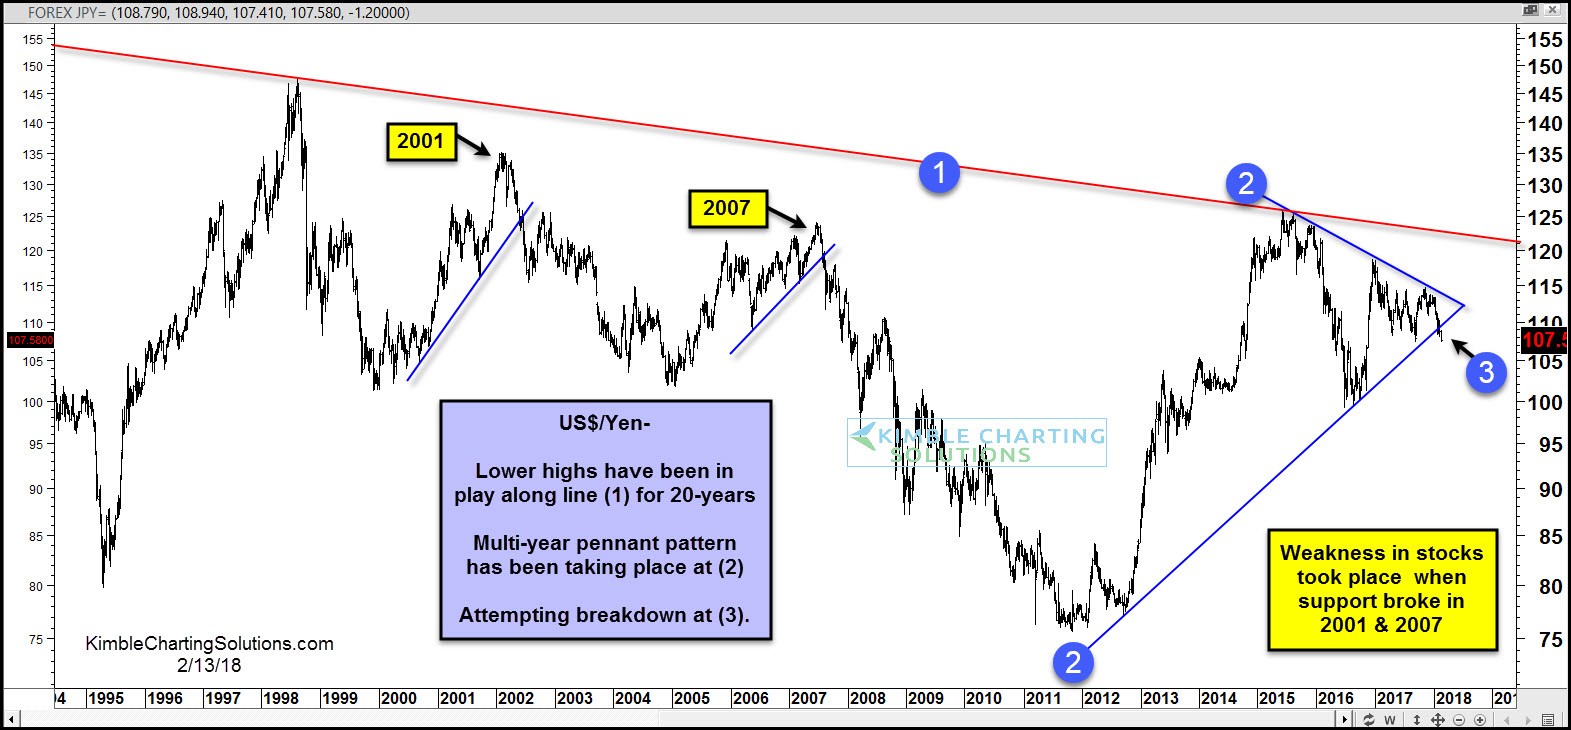
Below looks at a chart of the US$/Yen over the past 20-years :

The US$/Yen remains in a long-term down trend over the past 20-years as it has created a series of lower highs and lower lows. Over the past 7-years, the US$/Yen looks at have created a pennant pattern inside of lines (2).
Of late the US$/Yen is attempting to break below 6-year rising support at (3). This is important from a currency situation and could become important from a stock ownership angle too, as US$/Yen weakness in 2001 & 2007 was followed by equity softness too.
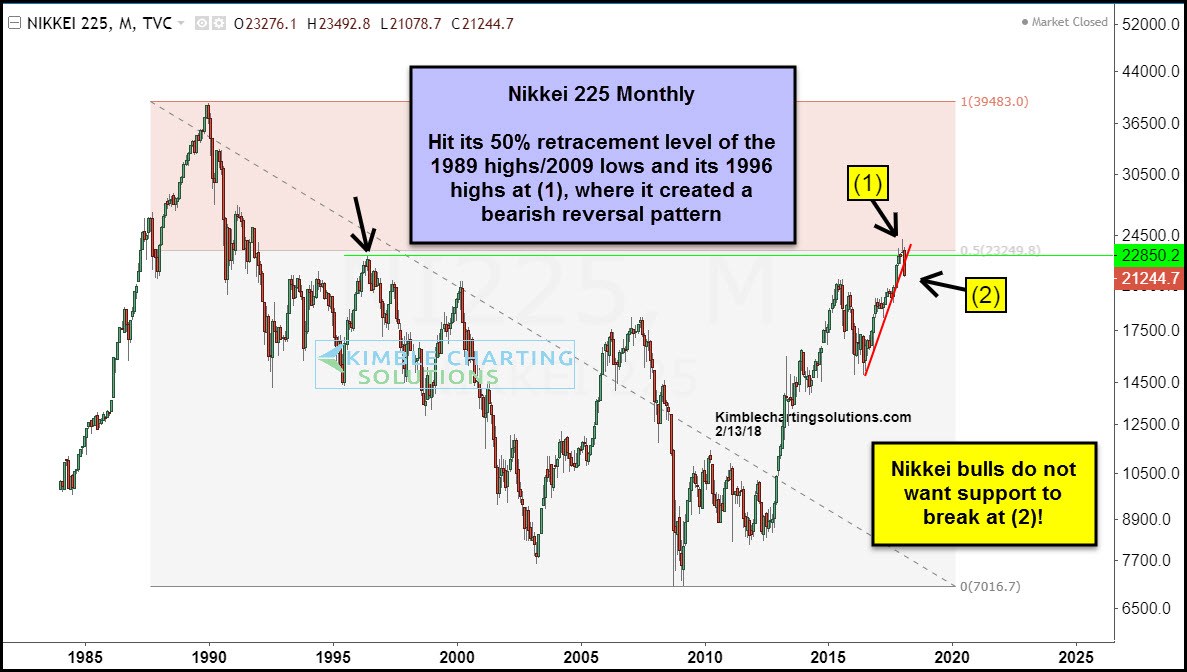
Below looks at chart of the Nikkei 225 Index over the past 30-years:

The trend off the 2009 lows in the Nikkei 225 remains up as it has created a series of lower highs and higher highs. The rally over the past few years brought it up to the highs of 1996 and the 50% retracement level of its crash from the highs in 1989 and the lows of 2009 at (1). While hitting this dual resistance test, the Nikkei created a reversal pattern (bearish reversal wick) at (2) a couple of months ago.
Weakness of late now has the Nikkei testing 2-year rising support at (2).
US$/Yen and the Nikkei 225 are both testing rising support at the same time in each of the charts above. US$/Yen and Nikkei bulls do not want to see support break by each of these at the same time. Humbly this seems like an important test for both currently!!!


Leave A Comment